Figures & data
Figure 1. The Kangerlussuaq–Sisimiut region of west Greenland (indicated by the orange polygon on inset) is bounded on all sides by the Davis Strait, Nordre Isortoq Fjord, the Inland Ice, and the Sukkertoppen ice cap (starting at the west, clockwise). Two villages in the region, Kangerlussuaq and Sisimiut, are designated by an orange inverted triangle and circle, respectively. (a) Data in the satellite image were generated using a median composite of all June imagery collected by Landsat 8 (2013–2018). Image product courtesy of the U.S. Geological Survey. (b) Elevation across the region is variable, with inland terrain lying closer to sea level, whereas coastal and southern areas are more mountainous
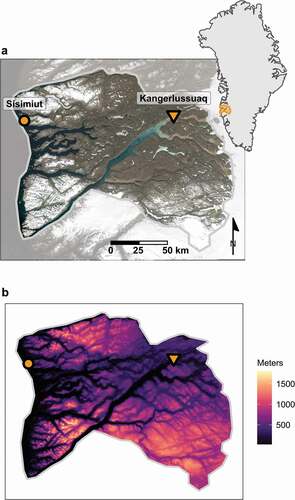
Figure 2. In the Kangerlussuaq–Sisimiut region (2001–2018), the timing of spring plant growth occurs earlier in years with warm springs and early snowmelt. (a) The mean regional temperature during May is the strongest single month temperature predictor of mean regional green-up timing (β = −3.05 ± 0.58, R2 = 0.63, F1,16 = 27.38, p < .05). Mean April temperature (not shown) is also significantly associated with regional green-up (April, β = −1.13 ± 0.46, p < .05, as a standalone predictor; when including both April and May as predictors, R2 = 0.73, F2,15 = 19.86, p < .001). (b) Spring green-up timing always follows snowmelt timing at the regional level, β = 0.598 ± 0.12, R2 = 0.60, F1,16 = 23.93, p < .001; black line indicates the 1:1 relationship
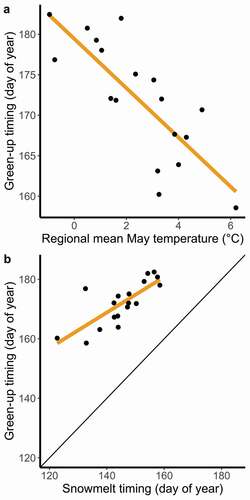
Figure 3. Across the Kangerlussuaq–Sisimiut region (2001–2018), spring green-up timing is delayed with (a) increasing elevation and (b) delayed snowmelt timing at the pixel level. Orange lines are linear regressions with spring green-up timing in response to either of the abiotic predictors: (a) β = 1.48 days/100 m elevation and (b) β = 0.53 days/day snowmelt. Black line in (b) is the 1:1 relationship
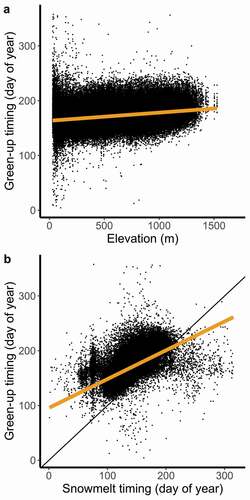
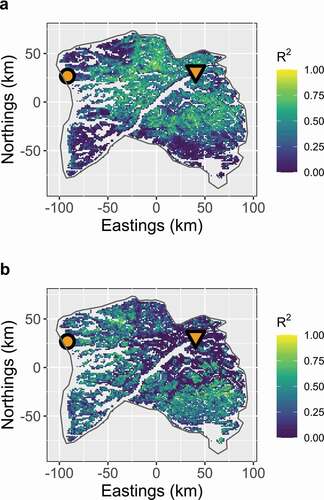
Figure 4. Proportion of interannual variance in green-up timing explained by (a) temperature and (b) snowmelt across the Kangerlussuaq–Sisimiut region (2001–2018). In general, temperature and snowmelt are inversely predictive of green-up timing (p < .001); areas exhibiting a strong relationship between temperature and green-up timing tend to exhibit a weak relationship between snowmelt timing and green-up timing and vice versa. Weather stations are denoted with an orange circle (Sisimiut) and triangle (Kangerlussuaq)