Figures & data
Figure 1. Map of the Matanuska–Susitna basin
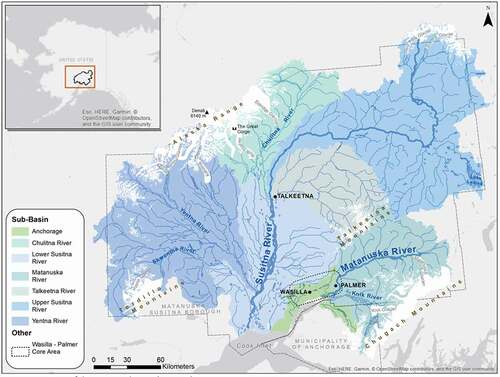
Table 1. Functional Components and Stressors of the Index of Catchment Integrity (ICI) and Index of Watershed Integrity (IWI). The stressors used for the ICI are accumulated at the catchment (CM) scale while the stressors used for the IWI are accumulated at the watershed (WS) scale. A ‘+’ denotes a stressor is included in a functional component, while a blank signifies it is absent
Figure 2. Maps of the ICI results (top) and the IWI results (bottom)
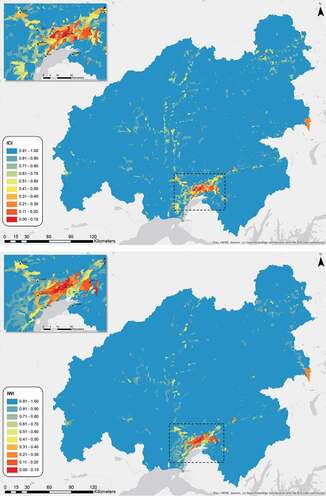
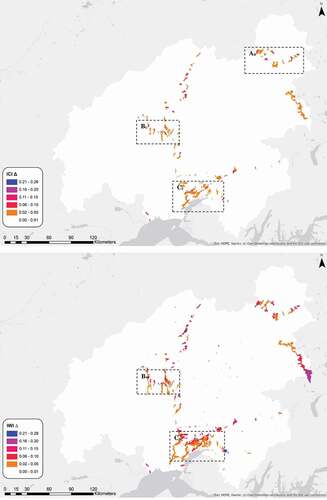
Figure 3. Map of the changes to ICI values caused by scenario 1 (top) and map of the changes to IWI values caused by scenario 1 (bottom) where Ac highlights large changes to ICI scores in catchments with high integrity along the Denali Highway; Bc highlights large changes to ICI scores in catchments with high integrity along the Petersville Road, and BW highlights large downstream changes to IWI scores in watersheds with high integrity; Cc highlights the relatively small changes to ICI scores in the highly developed core area compared to CW, which highlights larger changes to the IWI scores or the accumulated downstream impact of scenario 1