
Figures & data
Table 1. Basic information of the borehole
Figure 1. Location of the DK-12 borehole (red point) and the nearby three weather stations (green points)
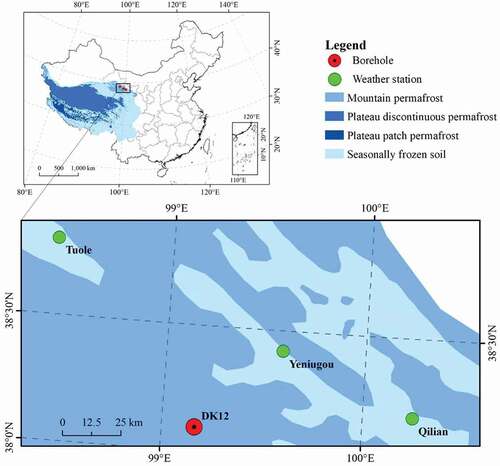
Table 2. Depths of the soil temperature sensors
Table 3. Details of drilling core layers in borehole DK12
Figure 2. Temperature–depth profiles of the DK-12 borehole (blue lines) on 31 December 2017, shown as the blue line with points. Black lines represent the long-term background temperature profiles. The shaded area represents anomalous temperature resulting from surface ground temperature variation, and the values are represented by pink points that start below 20 m
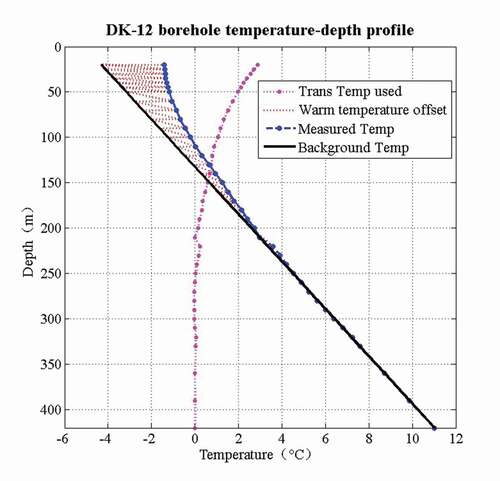
Figure 3. L-Curve rule for choosing the regularization parameter for Tikhonov regularization. The number in the L-curve are values of regularization parameters to imply the sensitive of results to regularization parameter
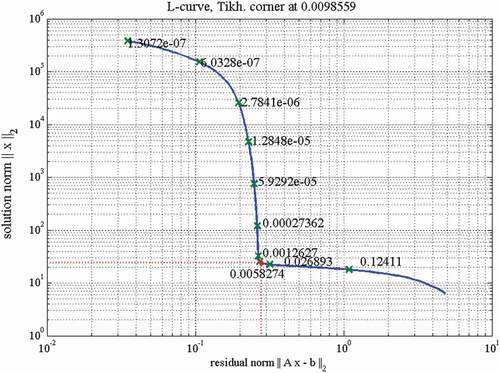
Figure 4. Estimated GSTH for the Muli area with the Tikhonov method from 600 to 2017 A.D. (blue line) and the surface air temperature measured from Yeniugou observation station (red line)
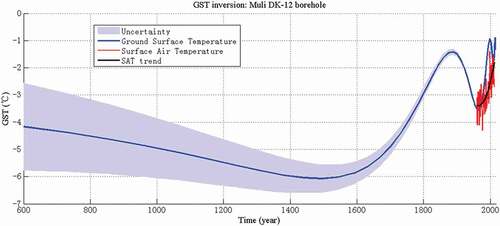
Figure 5. Detailed GST history for Muli area with the Tikhonov method from 1800 to 2017 A.D. (blue line) and the surface air temperature measured from Yeniugou observation station (red line)
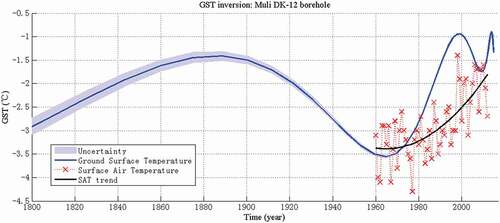
Figure 6. Measured (black line) and posteriori (blue line) T-z profiles for the DK-12 borehole data, corresponding to the GST histories by the Tikhonov method. The red line shows the deviation between measured and posteriori T-z profiles
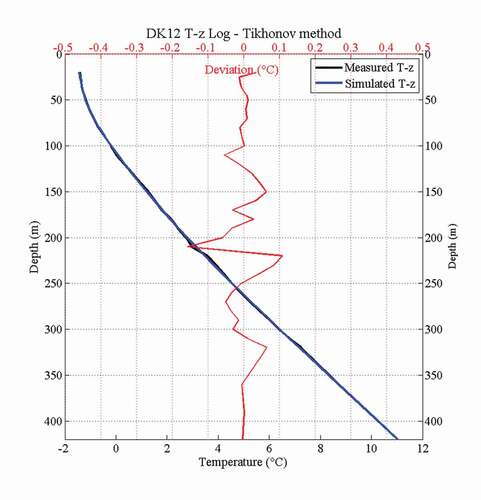
Table 4. Climate change and geothermal gradient parameters from Muli DK-12 borehole