Figures & data
Figure 1. Location map of the Toolik Field Station in northern Alaska. The inset shows the study area in relation to the circumpolar arctic region (graphic courtesy of Toolik Field Station)
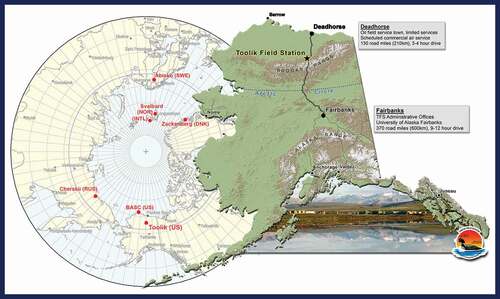
Figure 2. Experimental configuration showing cross section of snowdrift distribution leeward of the snow fence, with locations of core samples (deep, intermediate, low) and corresponding winter snow depths (m) in this study (modified from M. D. Walker et al. Citation1999)
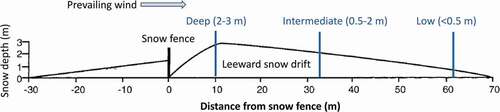
Figure 3. Location map showing collection sites within snow fence experimental plot for core samples measured in this study. Open circles indicate cores reflecting ambient winter snow conditions; filled circles indicate cores for which snow depth was affected by snow fence. Snow fence is approximately 600 m south of Toolik Lake at ~50 m elevation above lake level. Prevailing wind direction is southerly
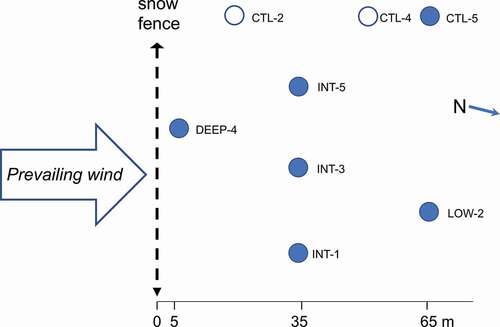
Figure 4. Activities (mBq g−1) of unsupported 210Pb, 7Be, 137Cs, and 241Am vs. depth (cm) in active layer soil core samples. Note different x-axis range of core profile DEEP-4
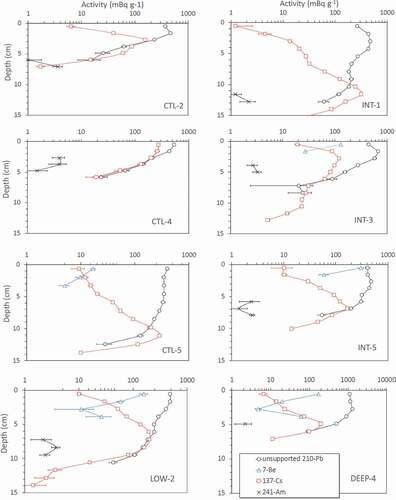
Table 1. Carbon accumulation rates, radionuclide inventories, and 210Pb fluxes.a
Figure 5. Hypothetical modifications of CRS models for simulated core profiles showing cumulative carbon (g cm−2) vs. ln(A0/AZ). Carbon accumulation rates (CAR) and 210Pb depositional fluxes were plotted with different arbitrary Y-intercept values to allow different models to be easily distinguished graphically, using equal values of CAR prior to 1994 in all models. Model A is a standard CRS model with 210Pb flux and CAR held constant. In model B, 210Pb flux is doubled after 1994 while CAR remains constant. In model C 210Pb flux remains constant and CAR is doubled after 1994. In model D both 210Pb flux and CAR are doubled after 1994. In model E both 210Pb flux and CAR are tripled after 1994
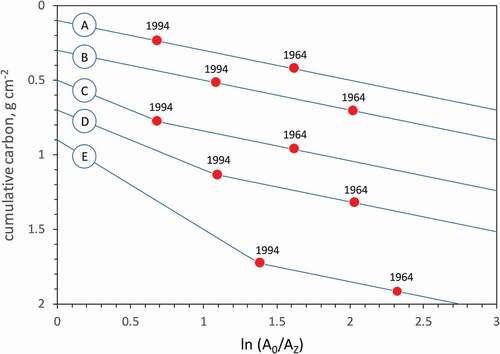
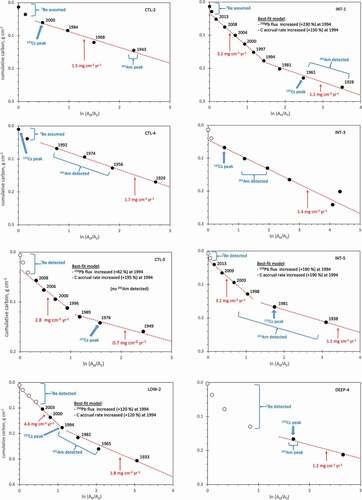
Figure 6. Modified CRS plots for measured core profiles showing cumulative organic carbon (g cm−2) vs. ln(A0/AZ). Note differences in ranges of x- and y-axis values. Dashed lines are best-fit linear regressions. Numerals adjacent to data points correspond to calendar years calculated from ln(A0/AZ). Net carbon accumulation rates (mg cm−2 yr−1) were obtained from slopes of regression lines. Data points having 7Be (detected or assumed) are excluded from regressions