Figures & data
Figure 1. Catchments and river corridor areas in the FCW
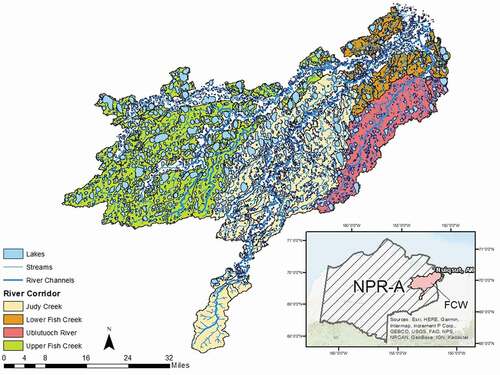
Figure 2. Field-validated catchments in the FCW, visited in July. Locations of oblique images () and erosion analysis () are also shown
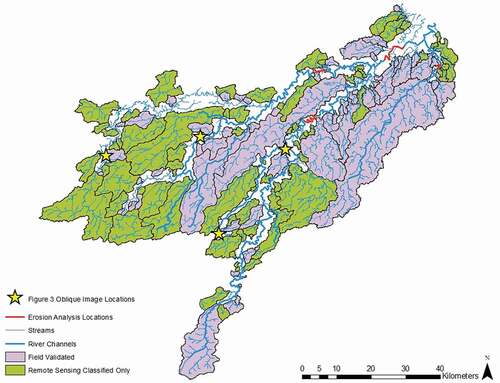
Figure 3. Oblique (left column) and satellite (right column) images of the four example catchment/riparian connectivity classes. The opaque red triangle on the satellite images shows the point of view seen in the oblique images. Connectivity classes shown are as follows: (a) no barriers, (b) wetland flowthrough, (c) subsurface flow, and (d) knickpoint. Locations of these images can be found on
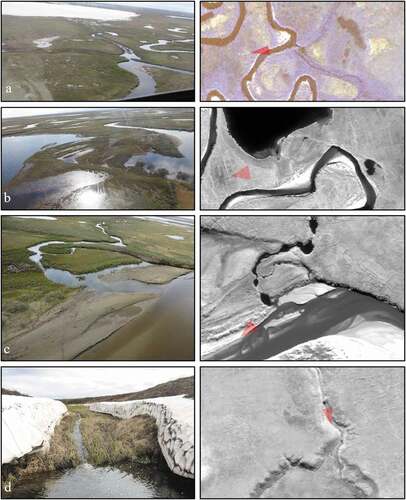
Figure 4. Total connectivity classes explained
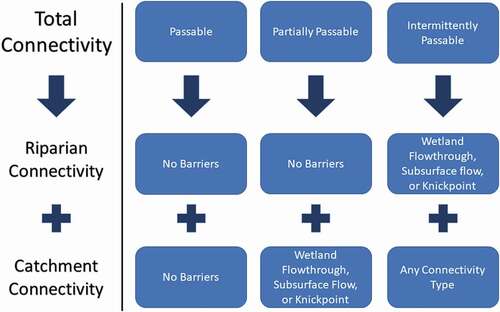
Figure 5. Shorelines drawn in ArcMap for (a) Judy Creek, (b) Upper Fish Creek, (c) Lower Fish Creek, and (d) the Ublutuoch River for use with the DSAS tool to perform the erosion analysis. Locations of these images can be found in
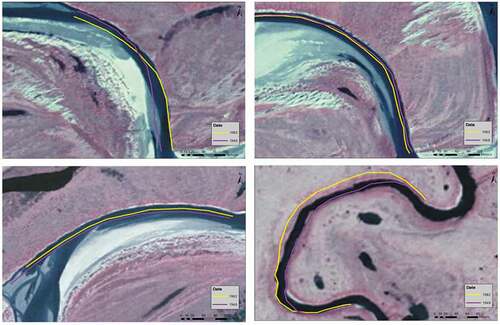
Table 1. Characteristics of the four main river corridors
Figure 6. Catchment connectivity and riparian connectivity in the FCW
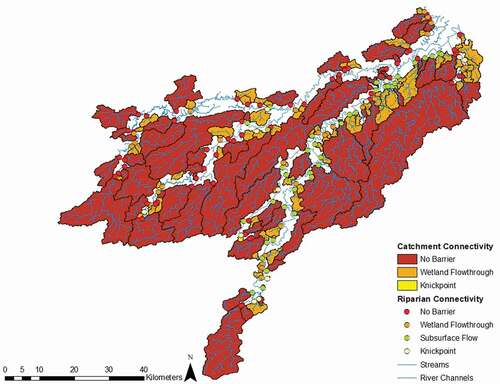
Figure 7. Total connectivity of catchments in the FCW
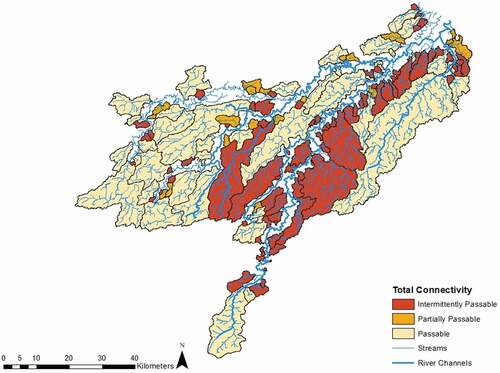
Figure 8. Hydrologic connectivity of river corridors in the FCW
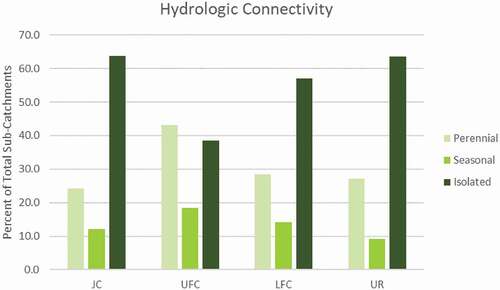
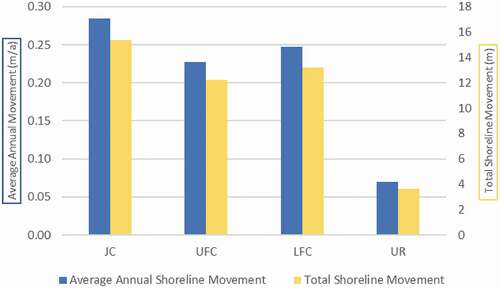
Figure 9. Average and total shoreline erosion rate for each river corridor