Figures & data
Figure 1. (a). Index map showing the study area location in northern Nares Strait and the general ocean circulation with polar water (PW), depicted by white arrows, and Atlantic water (AW), depicted by red arrows. WGC = West Greenland Current. (b). Location map of the study area showing the Uwitec (black dots) and multicore (yellow dots) site locations against the detailed bathymetry and satellite imagery of the area. The ice tongue margin in 2010 is shown by a white line. Uwitec sites 1 and 6 are at the locations of drill sites DS1 and DS3, respectively, which are the location of conductivity–temperature–depth (CTD) casts DS1 and DS3 of Figure 2. Other CTD stations of are shown by white hexagons with white station numbers underlined. Ocean current colors are as in (a) with the addition of glacial meltwater and runoff depicted by blue arrow exiting Petermann Fjord. Note that AW flows in the subsurface. The image base of the map is a composite of two Landsat 8 images from 11 August 2015 (bands 4, 3, 2) to make an RGB image. The Landsat Scene IDs for the two images for the composite are: LC80372472015223LGN02 and LC80372482015223LGN02
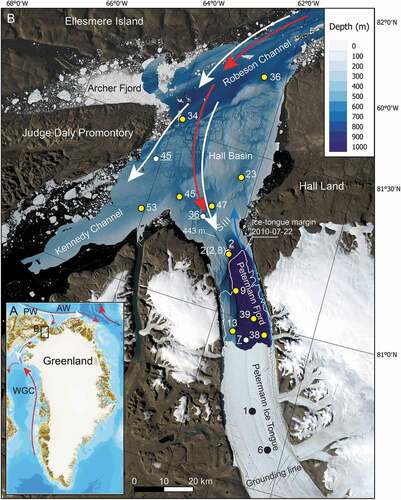
Figure 2. Examples of temperature (red) and salinity (blue) water column profiles from beneath the Petermann ice tongue (PIT), within Petermann Fjord (PF), and in Hall Basin (HB). Locations of conductivity–temperature–depth (CTD) profiles shown in . DS1 and DS3 are the locations of two drill sites through the PIT and are the same locations as 1UW and 6UW, respectively (). CTD data are from Muenchow (Citation2019). AW = Atlantic water as defined by Heuzé et al. (Citation2017). Overlying the AW are various mixtures of polar water, glacial meltwater and runoff, and Atlantic water
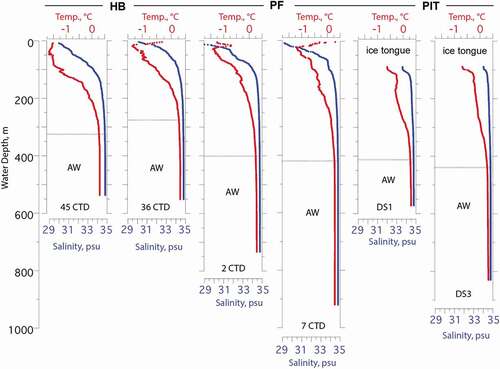
Figure 3. Modis satellite images from (a) 2 August and (b) 11 August 2015 showing the main changes in sea-ice conditions during OD1507 when the seabed samples were taken. Images courtesy of the NASA Worldview application (https://worldview.earthdata.nasa.gov/)
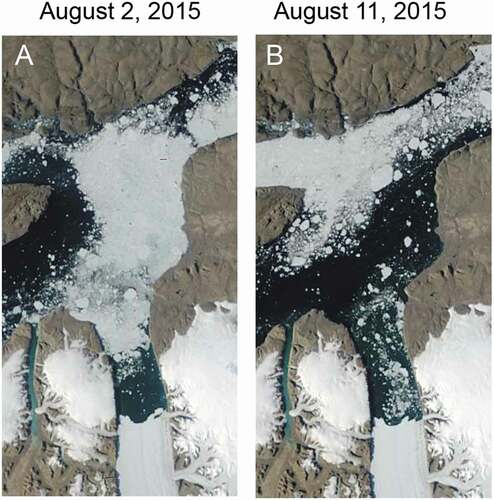
Table 1. Environmental data and location information for OD1507 multicore and Uwitec core tops
Figure 4. Grain size spectra of the multicore tops showing the distribution of particle sizes between 2,000 and 1 µm on a log scale. Grain size divisions of sand, silt, and clay are shown along the x-axis. Further grain size subdivisions of sand and silt are vc = very coarse, c = coarse, f = fine, vf = very fine. Samples are listed in order of distance from the grounding line
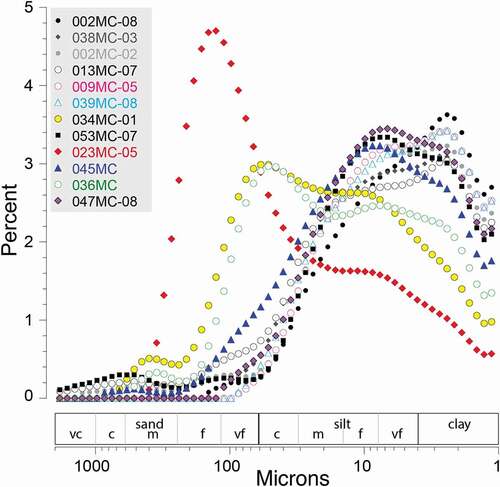
Table 2. Foraminiferal taxa identified in this study with their original reference. Calcareous and agglutinated species are separated and listed alphabetically. Referral to the plate and number is provided if taxa are illustrated herein
Figure 5. Histogram showing the numbers per milliliter of wet sediment of planktonic (green), calcareous benthic (red), and agglutinated benthic (blue) foraminifera from sites in Nares Strait (brown background), Petermann Fjord (yellow background), and beneath the Petermann Ice Tongue (PIT; blue background). Sites are arranged by distance from the Petermann Glacier grounding line. Site locations shown in
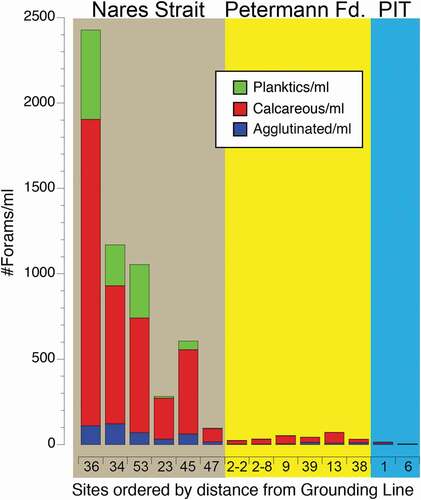
Figure 6. Histograms showing the percentages of (a) agglutinated foraminifera, (b) calcareous foraminifera, and (c) the proportion of living (stained) foraminifera from the fourteen sites arranged by distance from the Petermann Glacier grounding line; color blocks as defined in . Darker colors in (a) and (b) represent the living component and lighter colors represent the dead (unstained empty test) component of the total calcareous and agglutinated benthic foraminifera. PIT = Petermann Ice Tongue. Site locations shown in
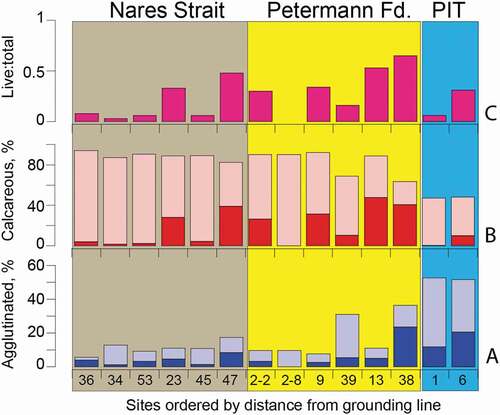
Figure 7. Histograms showing percentages of species along a transect organized by increasing distance from the Petermann Glacier grounding line. Sites are shown in . Color blocks as defined in . Red histograms are calcareous species, with the dark color representing the rose bengal stained (living) component. Blue histograms represent agglutinated species, with the dark color representing the rose bengal stained (living) component
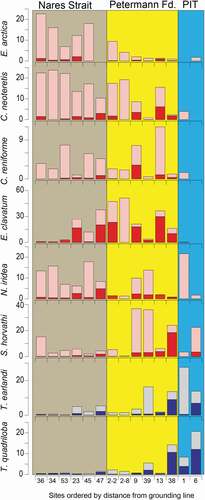
Figure 8. Histograms showing measures of diversity from the fourteen sites arranged by distance from the Petermann Glacier grounding line. (a) Species richness or number of species, S; (b) Evenness, E; and (c) Shannon Index, H. PIT = Petermann Ice Tongue. Site locations shown in . Color blocks as defined in
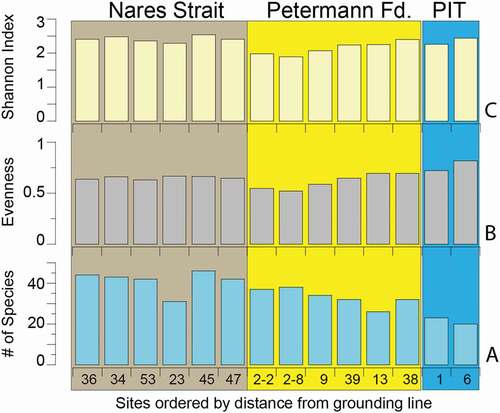
Figure 9. R-mode cluster dendrogram showing two major clusters of species (C1 and C2) as well as the division of C1 into C1a and C1b
Figure 10. Q-mode cluster dendrogram showing the three main clusters of sites (C1, C2, C3) that represent major geographic areas. Cluster 2 is represented by two subclusters, C2a and C2b
Figure 11. PCA biplot showing site scores and species loadings on PC Axes 1 and 2
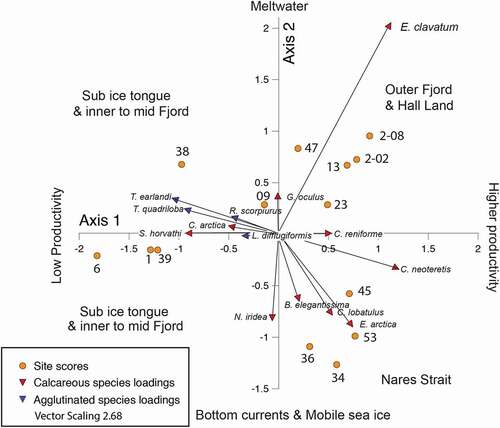
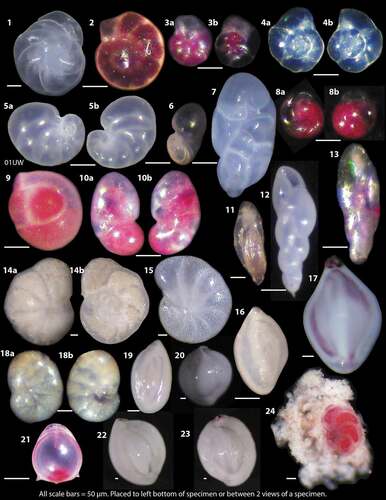
Plate 1. Examples of agglutinated foraminifera from OD1507 surface samples as light microscope photographs. Pink colored specimens were alive at the time of collection. 1 = Lagenammina difflugiformis, 6UW. 2 = Textularia earlandi, 6UW. 3 = Textularia torquata, 45MC. 4 = Pseudobolivina antarctica, 45MC. 5a, 5b = Portatrochammina bipolaris dorsal (5a) and umbilical of a different specimen (5b), 38MC. 6 = Reophax scorpiurus, 39MC. 7a, 7b = Trochammina quadriloba dorsal (7a) and umbilical (7b), 39MC. 8 = Rhizammina alageformis, 39MC. 9a, 9b = Trochammina nitida dorsal (9a) and umbilical (9b). 10 = Trochammina quadriloba umbilical, 6UW. 11 = Reophax catenata, 13MC. 12 = Reophax subfusiformis, 38MC. 13 = Reophax bilocularis, 39MC. 14 = Silicosigmoilina groenlandica, 9MC. 15 = Reophax dentaliniformis, 47MC. All scale bars are equal to 50 µm and are placed at the bottom left of each photo
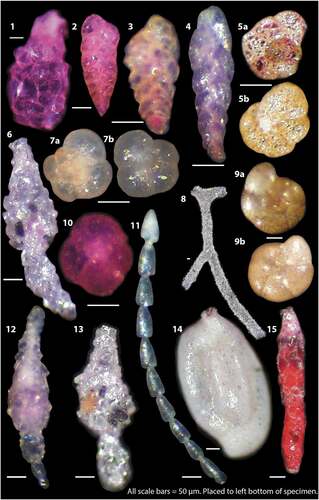
Plate 2. Examples of calcareous benthic foraminifers from OD1507 surface samples as light microscope photographs. Pink colored specimens were alive at the time of collection. 1 = Cassidulina neoteretis from 09MC. 2 = Elphidium clavatum (live) from 09MC. 3a, 3b = Stetsonia horvathi, umbilical (3a) and dorsal (3b) sides from 38MC. 4a, 4b = Stetsonia horvathi, dorsal (4a) and spiral (4b) sides from 39MC. 5a, 5b = Nonionella iridea, spiral (5a) and umbilical (5b) sides from 1UW. 6 = Nonionella iridea apertural view from 47MC. 7 = Robertinoides charlottensis, 39MC. 8a, 8b = Epistominella arctica, apertural (8a) and dorsal (8b) from 53MC. 9 = Glomulina oculus with three chambers from 47MC. 10a, 10b = Ceratobulimina arctica spiral (10a) and apertural (10b) views from 9MC. 11 = Buliminella elegantissima, 47MC. 12 = Stainforthia concava, 9MC. 13 = Stainforthia feylingi, 13MC. 14a, 14b = Cibicides lobatulus, umbilical (14a) and dorsal (14b) views, 53MC. 15 = Melonis baarleeanus, 36MC. 16 = Triloculina trihedra, juvenile, 34MC. 17 = Triloculina trihedra, adult 45MC. 18a, 18b = Valvulineria arctica, dorsal (18a), umbilical (18b), 45MC. 19 = Quinqueloculina sp. 23MC. 20 = Quinqueloculina akneriana, 09MC. 21 = Parafissurina arctica, 9MC. 22 = Quinqueloculina seminulum, 23MC. 23 = Quinqueloculina arctica, 23MC. 24 = Cibicidoides wuellerstorfi, 38MC. All scale bars are equal to 50 µm and are placed at the bottom left of each photo