Figures & data
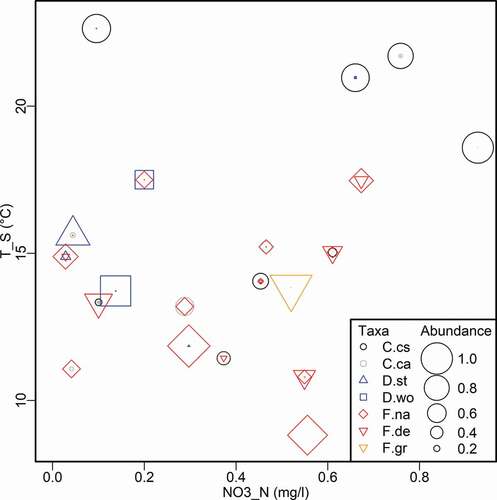
Figure 1. Geographical and zonal locations of the sampled lakes in the northern Alps in Austria and Germany. Background map based on Natural Earth data (Citation2020).
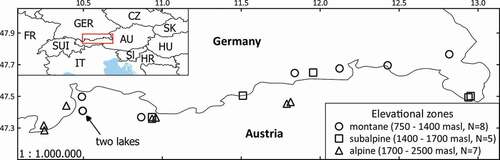
Table 1. Descriptive metrics of the measured and calculated environmental variables of the twenty-lake set
Figure 2. Principal component analysis correlation biplot for nineteen environmental variables measured in twenty mountain lakes in the northern European Alps. Principal components 1 and 2 (PC1, PC2) are plotted. λ indicates eigenvalues, var indicates percentage of explained variance. For variable and lake abbreviations, see Table S1.
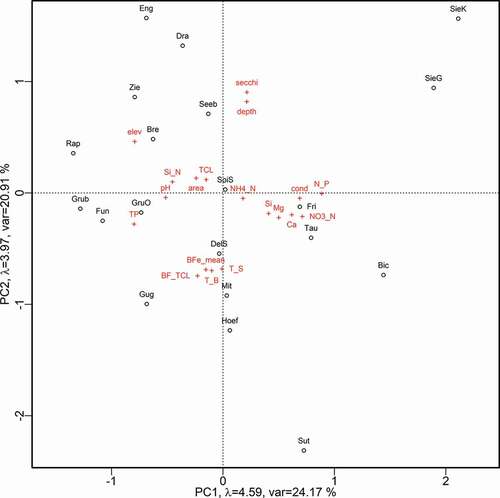
Table 2. Adjusted R² values for a planktic diatom RDA model with backward selected variables. Explained variance and p values were inferred from Monte Carlo permutation test
Figure 3. RDA correlation biplot of species scores and environmental parameters that significantly and independently influenced diatom taxon composition as determined by backward selection applied to RDA models for planktic diatom assemblages of twenty lakes. For variable, species, and lake abbreviations, see Table S1 and Table S2.
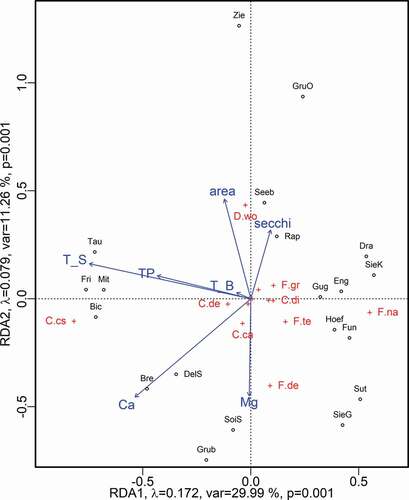
Figure 4. Relative abundances of Cyclotella comensis plotted against August surface temperature and thermocline depth. R2 values and p values are given for generalized linear models; model prediction curves are plotted for significant models (p < .05). For abbreviations and units, see .
Table 3. Model coefficients for generalized additive models for abundance of cyclotella comensis in response to environmental variabels that proved to be important for Cyclotella comensis abundance based on GLM results and are known to be ecologically important factors influencing the taxon. For abbreviations see
Figure 5. Generalized additive model results for the relative abundance of Cyclotella comensis and its interaction with August surface temperature and nitrogen-N. For model scores, see Table 3.
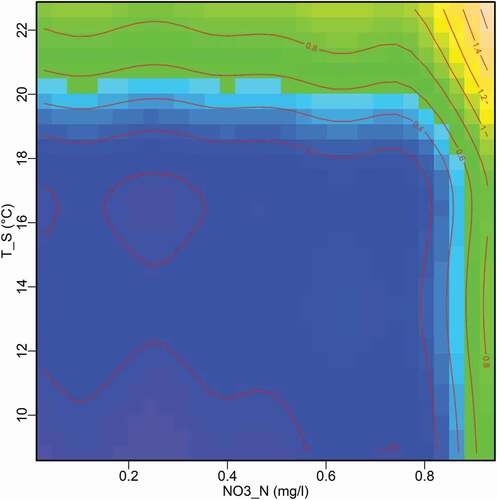
Figure 6. Scatterplot depicting relative abundances of the most frequent taxa in the data along the nitrate-N gradient and the August surface temperature gradient. The plotted taxa represent 93 percent of all counts. For species abbreviations, see Table S2.