
Figures & data
Table 1. Summary of the statistical analyses of the various experimental treatment effects on aboveground biomass among the three point frame years for the six major vascular plant species and lichens and mosses in mesic birch hummock tundra under different experimental manipulations
Table 2. Effects of time (i.e., year of point framing), of the individual experimental manipulations, and of their interactions on aboveground biomass of the six major vascular plant species in mesic birch hummock tundra vegetation
Figure 1. Aboveground biomass changes (a)–(f) for each of the six major vascular plant species, (g) for total vascular community, and (h) and (i) for the lichen and moss communities, respectively, over time (2005, 2011, and 2017) under control (solid lines) and greenhouse (dashed lines) plots in mesic birch hummock vegetation. Error bars are standard deviations (n = 10; note the varying biomass scales used for the different species) and in some cases extend below zero but are not shown. Two-way mixed-model factorial ANOVAs, with time as the within-subjects factor and the greenhouse experimental manipulation as the between-subjects factor, are used for statistical analyses. Statistically significant effects of time, greenhouse, and their interactions are indicated by *p < .05, **p < .01, with all statistical information provided in Appendix S4
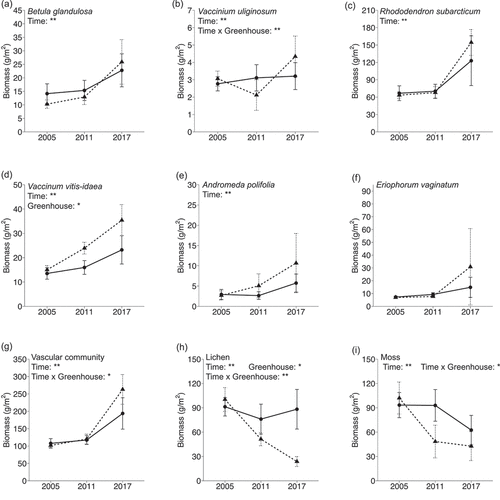
Figure 2. Aboveground biomass of the six vascular plant species and the lichen and moss communities under ambient environmental conditions (i.e., control plots; n = 25) in each of the point frame years (2005, 2011, and 2017). Error bars are standard deviations. For the vascular species, total aboveground biomass significantly increased between 2011 and 2017 for all species except E. vaginatum and for all species between 2005 and 2017. For lichens, total aboveground biomass significantly decreased between 2005 and 2011 and then significantly increased between 2011 and 2017. For mosses, total aboveground biomass remained unchanged between 2005 and 2011 but significantly decreased between 2011 and 2017. See Appendix S6 for full statistical information
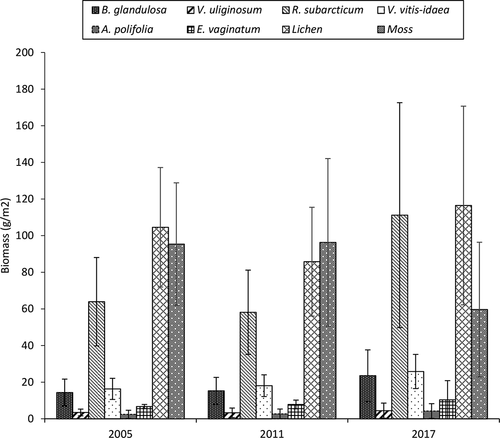
Figure 3. Monthly mean diel air temperature for late spring to early fall at Daring Lake over the three time periods of the point framing sampling (2000–2005, 2006–2011, and 2012–2017). Different labels (a), (b), and (c) indicate significant differences among time periods for each month at level of α = 0.05 (n = 6). Bolded lines indicate the median; boxes represent the 25th and 75th percentiles, and whiskers represent the 0th and 100th percentiles (excluding outliers). Black solid dots indicate outliers, which are defined as values more than 1.5 times the interquartile range either below the 25th quartile or above the 75th quartile
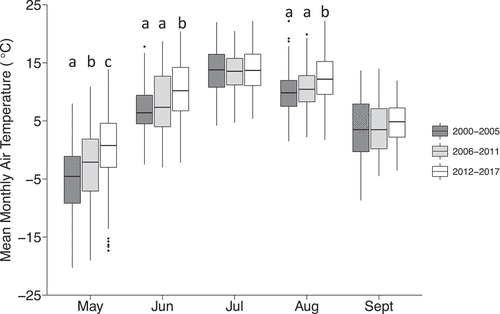
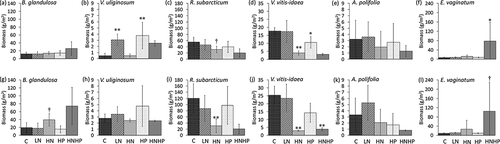
Figure 4. Individual vascular plant species aboveground biomass responses to fertilization (a)–(f) in 2011 and (g)–(l) in 2017. C = control, LN = low-level nitrogen addition, HN = high-level nitrogen addition, HP = high-level phosphorus addition, and HNHP = high-level nitrogen + high-level phosphorus addition. Error bars are standard deviations (n = 5); note the varying biomass scales used for the different species and for the different years. Statistically significant effects are indicated by †p < .1, *p < .05, and **p < .01. See Appendix S7 for full statistical information
Supplemental Material
Download Zip (94 KB)Data availability statement
The data from this study will shortly be available on the Polar Data Catalogue website (https://www.polardata.ca/).