1,520
Views
7
CrossRef citations to date
0
Altmetric
Research Article

Soil microbial abundance and activity across forefield glacier chronosequence in the Northern Patagonian Ice Field, Chile

ORCID Icon, ORCID Icon, ORCID Icon, ORCID Icon, ORCID Icon, ORCID Icon, ORCID Icon & ORCID Icon show all
Pages 553-562 | Received 26 Mar 2020, Accepted 02 Sep 2020, Published online: 22 Oct 2020

Figures & data

Figure 1. Study site description: a) Satellite image illustrating the retreat of the Exploradores glacier in last 70 years. Color lines show the age-limit of the three stages of soil development. b) Photo showing a frontal view of Exploradores forefield glacier. c) A principal component analysis (PCA) of soil features during soil development. F and P-value correspond to PerManova test results. Open symbols: stage 1; light grey: stage 2; dark grey: stage 3

Figure 1. Study site description: a) Satellite image illustrating the retreat of the Exploradores glacier in last 70 years. Color lines show the age-limit of the three stages of soil development. b) Photo showing a frontal view of Exploradores forefield glacier. c) A principal component analysis (PCA) of soil features during soil development. F and P-value correspond to PerManova test results. Open symbols: stage 1; light grey: stage 2; dark grey: stage 3

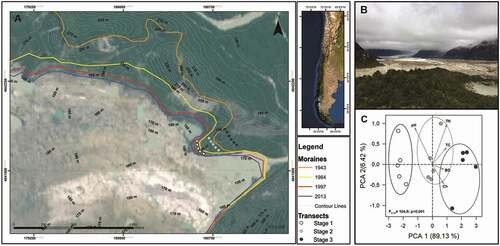
Table 1. Changes in soil biogeochemical features across three stages of soil development of the NPFI chronosequence

Table 2. Differences in the relative abundance of microbial groups, measured as ratios across the three stages of soil development of the NPFI glaciar retreat chronosequence

Figure 2. Changes in microbial community abundance and the nifH gene (i.e. nitrogen cycle gene) across stages of soil development at the NPIF. In a) Archaeal, b) Bacterial, c) Fungal abundances, and in d) nifH gene-copy number. Bars represent mean values and ±1 SE of gene abundance from five samples. Different letters shows significant differences across stages of soil development for F and P-values of ANOVA given in right upper corner

Figure 2. Changes in microbial community abundance and the nifH gene (i.e. nitrogen cycle gene) across stages of soil development at the NPIF. In a) Archaeal, b) Bacterial, c) Fungal abundances, and in d) nifH gene-copy number. Bars represent mean values and ±1 SE of gene abundance from five samples. Different letters shows significant differences across stages of soil development for F and P-values of ANOVA given in right upper corner

Figure 3. Changes in the relative abundance of microbial groups as a function of changes in (a) soil C:N and (b) soil pH (i.e., soil variables with the highest relative contribution to change in microbial abundance). Circles: fungal-to-bacterial ratios; Triangles: archaeal-to-bacterial ratios across three stages of the NPFI. (c), (d) Changes in nifH gene copy number. For all panels, open symbols: stage 1; light grey: stage 2; dark grey: stage 3. Solid lines represent significant linear regression adjusted for variables

Figure 3. Changes in the relative abundance of microbial groups as a function of changes in (a) soil C:N and (b) soil pH (i.e., soil variables with the highest relative contribution to change in microbial abundance). Circles: fungal-to-bacterial ratios; Triangles: archaeal-to-bacterial ratios across three stages of the NPFI. (c), (d) Changes in nifH gene copy number. For all panels, open symbols: stage 1; light grey: stage 2; dark grey: stage 3. Solid lines represent significant linear regression adjusted for variables

Figure 4. Differences in mass loss (buried) across stages of soil development in the NPIF chronosequence. (a) Mass loss of Whatman filter after nineteen months in three stages of soil development. T1: after seven months, T2: after 12 months; T3: after nineteen months. (b) Relationship between mass loss of Whatman filters as a function of higher fungal abundance across stages of the NPIF chronosequence. Open circle: stage 1; light grey: stage 2; dark grey: stage 3. Solid lines represent a significant linear relationship (all data included)

Figure 4. Differences in mass loss (buried) across stages of soil development in the NPIF chronosequence. (a) Mass loss of Whatman filter after nineteen months in three stages of soil development. T1: after seven months, T2: after 12 months; T3: after nineteen months. (b) Relationship between mass loss of Whatman filters as a function of higher fungal abundance across stages of the NPIF chronosequence. Open circle: stage 1; light grey: stage 2; dark grey: stage 3. Solid lines represent a significant linear relationship (all data included)
Supplemental material

Supplemental Material

Download Zip (19.2 KB)