Figures & data
Figure 1. Study region map. Left: The Northern Andes of South America. Right: Detail of the area indicated by the blue square, Mérida State in the Venezuelan Andes. Shown are the city of Mérida and the location of the Sierra Nevada. The area of study is indicated by the red rectangle, corresponding to the region mapped in . Adapted from Anthelme et al. (Citation2014)
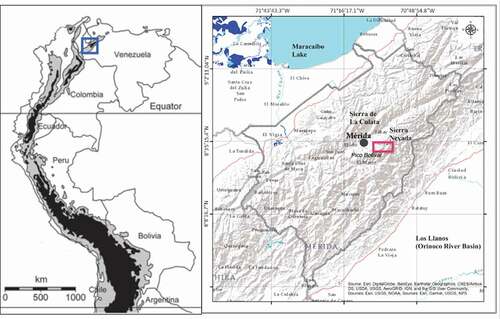
Table 1. Results for the change in surface area, perimeter, and elevation of the glacier terminus and highest portion (maximum) for the three glaciated regions/peaks in Sierra Nevada de Mérida (Venezuela) since 1910, based on our analyses of glacier cover and extent for each date
Figure 2. Synthesis of the main sources of information and the methods used to integrate this information and estimate changes in glacier coverage between 1910 and 2019 in the Sierra Nevada de Mérida, Venezuela
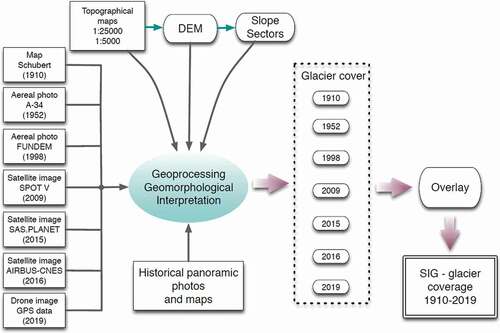
Table 2. Estimated average rates of retreat of the Humboldt Peak glacier (Venezuela), during the 1910–2019 period. Rates were calculated in terms of the average percentage loss in glacier area per year and in terms of the average change per year in elevation (vertical) and projected retreat in distance (longitudinal) of the glacier terminus on the northwest face
Figure 3. Some of the historic panoramic photographs used in this work and comparison with recent images: (A) La Corona glacier, then covering Humboldt and Bonpland peaks, seen from Pico Espejo in 1910 (Jahn Citation1925); (B) northwest face of Bolívar peak in 1910 (Jahn Citation1925); (C) southwest face of Bolívar peak in 1922 (Blumenthal 1922); (D) south face of Bolívar in 1922 (Blumenthal, 1922); (E) west side of La Concha seen from Bolívar (Blumenthal 1922); (F) La Corona glacier from Pico Espejo in 2013; and (G) northwest face of Bolívar in 2020 . Photos in (F) and (G) by J.M. Romero, used with permission
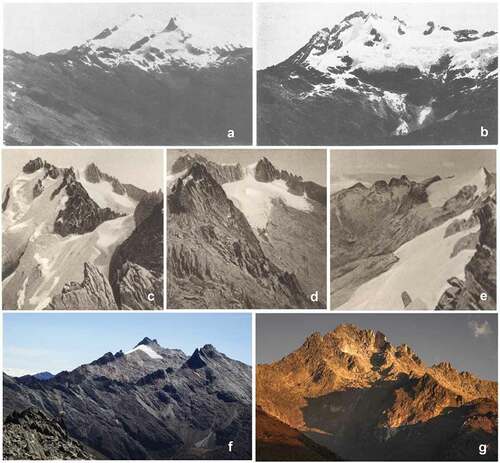
Figure 4. Examples of recessional moraines from the LIA in Humboldt Peak. (A) A 1910 photograph by Jahn (Jahn Citation1925) of the northern face, La Verde valley. (B) A 2019 photograph of the northwest face, Las Cascadas valley by L.D. Llambí. Labels M1, M2 correspond to those of the map in
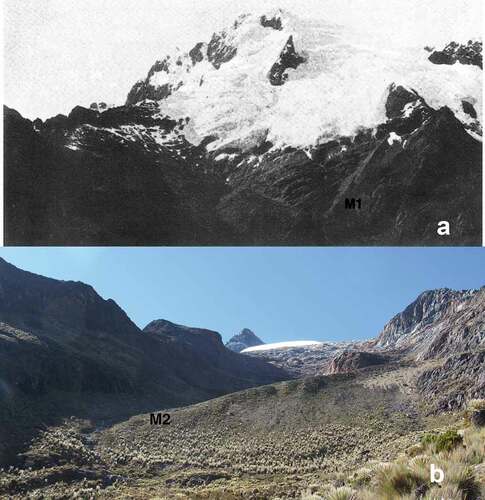
Figure 5. General view of glaciated areas in Sierra Nevada de Mérida (Venezuela), between Bolívar and Humboldt peaks from 1910 to 2019, drawn over a Spot satellite image of 2009. Main peaks and lakes (in blue) are indicated. The 1910 area should be considered a conservative estimate
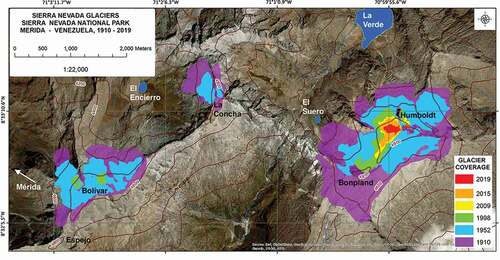
Figure 6. (A) Areas covered by the La Concha peak glaciers in 1910 and 1952, with El Encierro lake identified. The last glacier in this region (northwest side) disappeared in 1990. (B) Areas covered by glaciers around Bolivar Peak in 1910, 1952, and 1998, and the small patch in 2015 (no longer considered a glacier). Both maps are overlaid on the 1952 aerial photograph (aerial photos A-34, scale 1:20,000). The 1910 line is dashed to indicate less precision in the estimate for this date
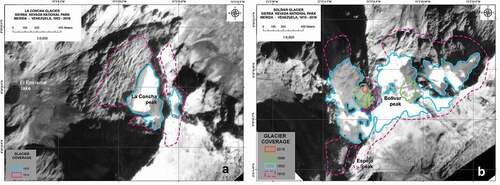
Figure 7. Areas covered by glaciers around Humboldt Peak, 1910–2019, overlaid on a Spot satellite image of 2009. The 1910 line is dashed to indicate less precision in the estimate for this date. LIA moraines in La Verde valley (M1), Las Cascadas valley (M2), and near El Suero lake (M3) are indicated
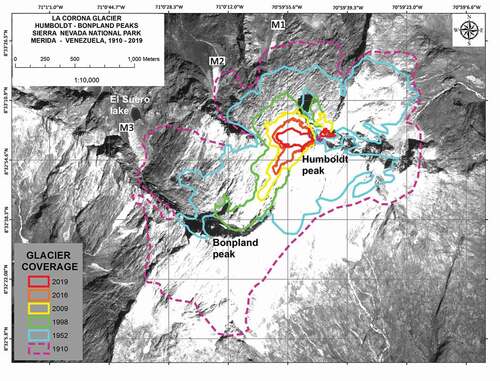
Figure 8. Estimates of surface area (km2) covered by glaciers for different dates between 1911 and 2019 in the Sierra Nevada de Mérida, Venezuela. (A) Sum of the total area for the three studied peaks (Sierra Nevada Total) as well as the desegregated glacier area for Humboldt, Bolívar, and La Concha Peaks. (B) Detail of the surface area for Humboldt Peak glaciers between 1998 and 2019