Figures & data
Table 1. General characteristics of study area glaciers
Table 2. Characteristics of study area weather stations
Table 3. Average annual retreat rates for the eight land-based study glaciers with estimated Little Ice Age maximum extents (LIAM date) based on tree-ring dating of moraines
Figure 1. Study area and glacier area loss between the 1950s and 2018
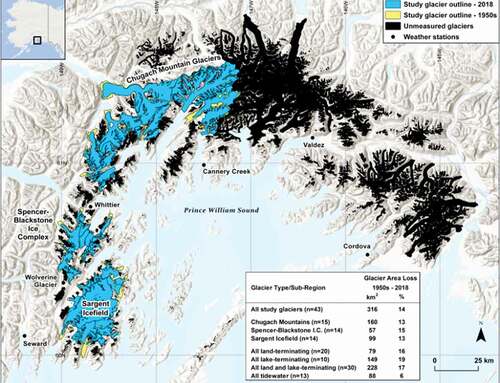
Table 4. List of six derived topographic and geometric variables
Table 5. Comparison of retreat rates and mean water depth for eight tidewater glaciers in the study area
Table 6. Average length and area change metrics for land-based and tidewater glaciers
Table 7. Regression between glacier area change from 1950s to 2018 and six derived morphometric variables
Table 8. Glacier mass (gigatons) and SLE changes from 1950–1957 to 2018
Figure 2. Percentage glacier length and area change since the 1950s. Vertical bars represent calculated uncertainty (one standard deviation)
Figure 3. (a) Average annual glacier retreat rates; (b) average annual glacier area change rates; and (c) total glacierized area annual change rates. Change rates presented by glacier type (land-based n = 30; tidewater n = 13)
Figure 4. Period area change rates (bars) and glacier area in 2018 (dashed line) for land-based glaciers
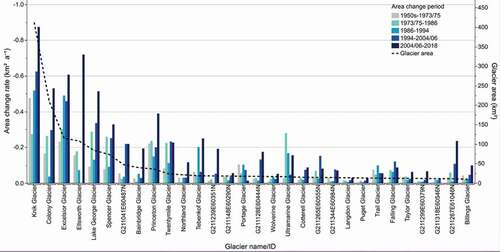
Figure 5. Length change rates for individual tidewater glaciers by time period
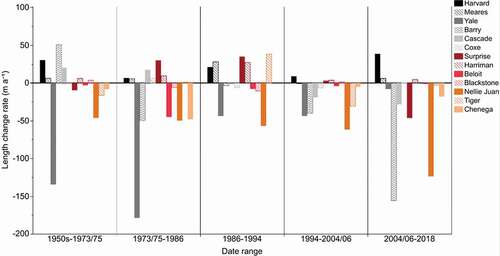
Figure 6. (a) Chronology of retreat for Nellie Juan Glacier between 1935 and 2018. Terminus position for 1935 from photographs in Field (1975; as cited in Wiles, Barclay, and Calkin Citation1999) and (b) chronology of retreat for Harvard and Yale glaciers between 1810 and 2018. Yale Glacier 1810 terminus position from Field and others (1958; as cited in Mercer Citation1961) and Harvard Glacier 1910 terminus position from Tarr and Martin (1914; as cited in Sturm et al. Citation1991)
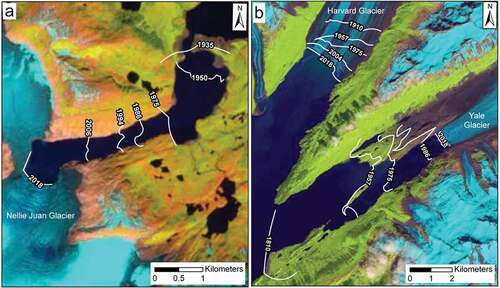
Figure 7. Time series of (a) mean annual temperature at Cordova Airport station; (b) average winter temperature (PWS maritime stations); (c) mean summer temperature at Wolverine Glacier Station; and (d) average winter precipitation (PWS maritime stations). Dashed lines show statistically significant trends
Figure 8. Comparison between (a) annual summer (May–September) and winter (October–April) temperature and precipitation; (b) mean annual summer sea surface temperatures; (c) Pacific decadal oscillation (PDO); (d) Arctic Oscillation (AO); and (e) length change rates for land-based and tidewater glaciers
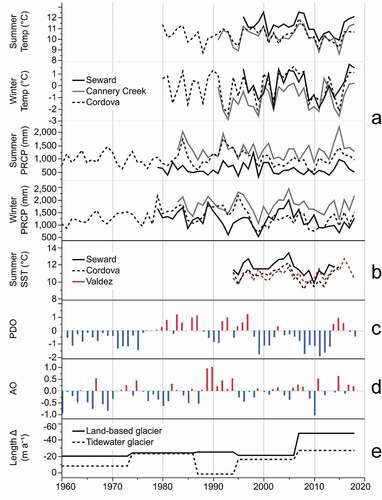
Figure 9. (a) Relationship between mean fjord water depth and retreat rates for tidewater glaciers and (b) comparison between tidewater glacier length and fjord width changes from 2004–2006 to 2018. Note, measurements based on early August 2004–2006 and late July 2018 imagery