
Figures & data
Figure 1. (a) Locations of the climate monitoring stations and park units in the NPS Arctic Inventory and Monitoring Network (ARCN): Bering Land Bridge National Preserve (BELA), Cape Krusenstern National Monument (CAKR), Gates of the Arctic National Park and Preserve (GAAR), Kobuk Valley National Park (KOVA), and the Noatak National Preserve (NOAT). (b) Stations in the NPS Central Alaska Inventory and Monitoring Network (CAKN): Denali National Park and Preserve (DENA), Wrangell–St. Elias National Park and Preserve (WRST), and Yukon–Charley Rivers National Preserve (YUCH).
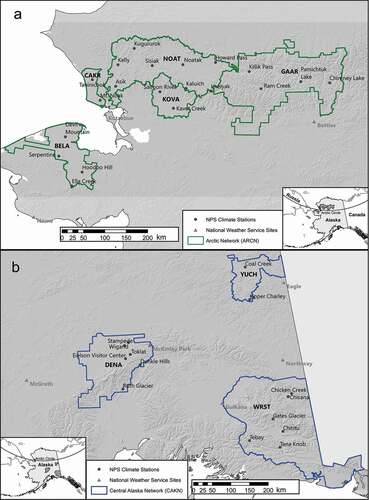
Figure 2. Mean annual ground temperatures (MAGT) at the top of the permafrost, from modeling by Panda, Marchenko, and Romanovsky (Citation2014a, Citation2014b, Citation2016). (a) The Arctic parks (see for the park acronyms). (b) Denali National Park and Preserve. (c) Wrangell–St. Elias National Park and Preserve.
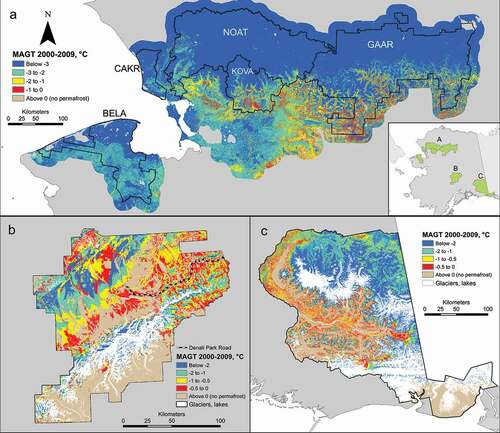
Table 1. Summary of permafrost temperatures in Alaska’s national parks.a
Figure 3. Mean annual air temperatures at Bettles, Alaska. Multiyear means are shown for 1984 to 2013 (brown), 2006 to 2013 (blue), and 2014 to 2019 (red).
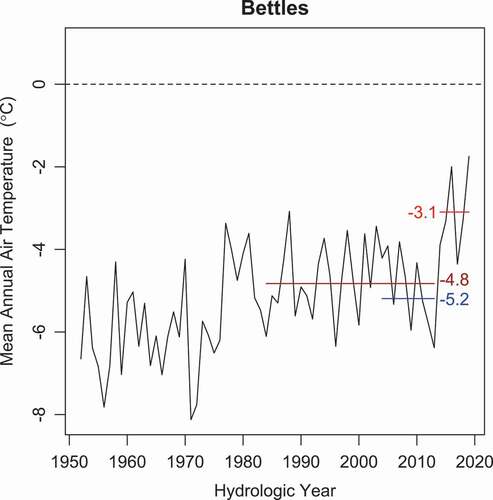
Table 2. Change in mean annual temperatures in 2014 at National weather service COOP stations and selected NPS stations.a
Figure 4. Change in mean air temperature between 2006–2013 and 2014–2019 at the NPS climate stations in ARCN and CAKN parks. Includes all remote monitoring stations in Arctic (ARCN) and Central Alaska (CAKN) NPS units that have no more than fourteen months of missing data in each of the indicated intervals (2006–2013 and 2014–2019). Temperature changes were also calculated for the Alaska climate divisions (Bieniek et al. Citation2012) for the same time periods (by water year) from regional data by NCEI (Citation2020). Darker shading indicates a larger temperature increase post-2013 and highlights the greater amount of warming in the west.
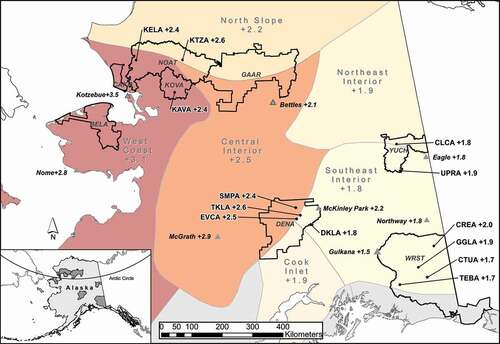
Figure 5. Average annual sum of freeze and thawing degree days at NWS stations surrounding the study area, during the periods 1984 to 2013 and 2014 to 2019.
Figure 6. Summary of air and ground temperatures in the Arctic parks before and after the 2014 temperature shift. Error bars give the t-test 95 percent confidence interval for the mean. Where error bars are missing there was less than two years of data. “Air PRISM” is the modeled mean air temperature for 1981 to 2010 by PRISM Climate Group (Citation2020). Station abbreviations (Supplementary Table S1) are arrayed along the bottom. The blue bar above the station identifier indicates permafrost was present (observed or inferred from temperatures).
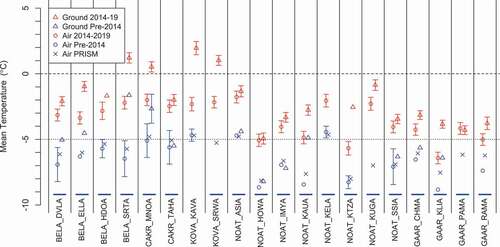
Figure 7. Summary of air and ground temperatures in the Central Alaska parks before and after the 2014 temperature shift. Error bars give the t-test 95 percent confidence interval for the mean. Where error bars are missing there was less than two years of data. “Air PRISM” is the modeled mean air temperature for 1981 to 2010 by PRISM Climate Group (Citation2020). Station abbreviations (Supplementary Table S1) are arrayed along the bottom. The blue bar above the station identifier indicates permafrost was present (observed or inferred from temperatures).
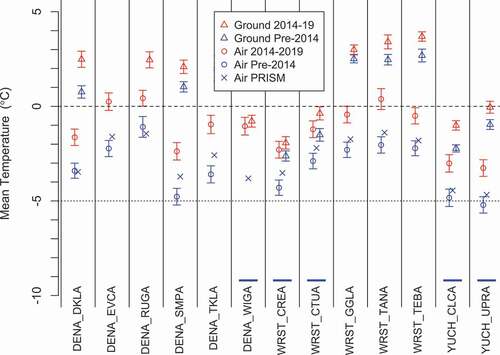
Figure 8. Plot of the change (from pre-2014 to 2014–2019) in mean air temperature vs. change in mean ground temperature at NPS climate monitoring stations. Circles (pf+) indicate stations where permafrost was present and triangles (pf−) indicate stations where permafrost was absent. Snowpack types are based on Sturm, Holmgren, and Liston (Citation1995). The sites from the Arctic (ARCN) and Central Alaska (CAKN) parks are enclosed with circles. The solid diagonal line marks equal change in air and ground temperatures (y = x), and the dashed line indicates where the change ground temperatures was half of the change in air temperatures (y = 0.5x).
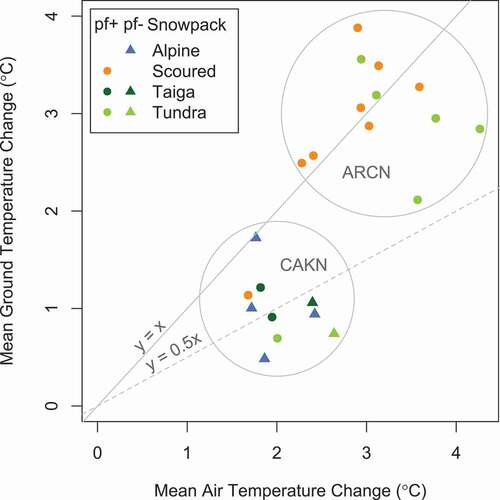
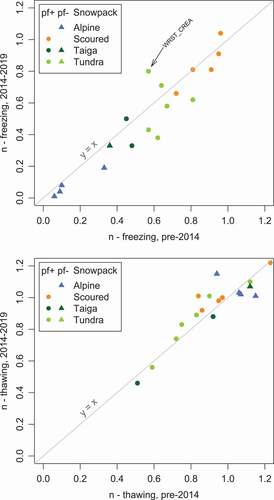
Figure 9. Plots of freezing n-factors (upper) and thawing n-factors (lower). The x-axes are n-factors for pre-2014 and the y-axes are n-factors for 2014 to 2019. The diagonal line marks equal n-factors pre- and post-2014.
Supplemental Material
Download Zip (694.7 KB)Data availability statement
The data analyzed in this report are openly available in the National Park Service Data Store at: