
Figures & data
Table 1. Study site characteristics with terrain ages of the moraines, elevation, slope exposition, slope, bedrock, vegetation cover, species richness, and vegetation type of Stein Glacier (Susten Pass) and Griess Glacier (Klausen Pass) forelands
Figure 1. Location of (A) the Griess Glacier foreland (46°50′ N, 8°49′ E) and (B), (C) the lower and upper parts of the Stein Glacier foreland (47°43′ N, 8°25′ E). The terrain age of the moraines is given in years (a) and thousands of years (ka). Inset in (A) Switzerland with locations of both study sites. Satellite images: Google Maps, 2020, https://google.de/maps/place/Schweiz/@46.6192509,7.4679619.
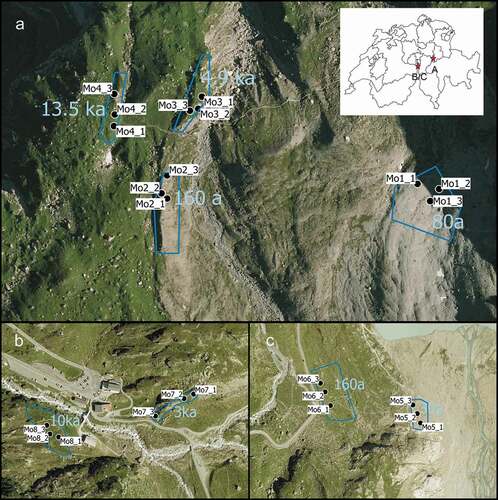
Table 2. List of traits investigated in the present study
Figure 2. Vertical distributions of mean FRMD, FRLD, SRL, and RTD per soil depth increment across the moraines of (a), (c), (e), (g) Stein Glacier and (b), (d), (f), (h) Griess Glacier forelands. Error bars show the standard error of the mean. The terrain age of the moraines is given in years (a) and thousands of years (ka).
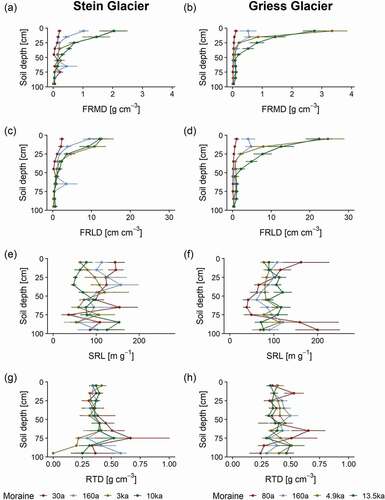
Figure 3. Effect sizes of FRMD, FRLD, SRL, and RTD of (a), (c), (e), (g) Stein Glacier and (b), (d), (f), (h) Griess Glacier forelands. Effect sizes indicate the rate of change of the root traits per 100 years of terrain age. The response variables are on a log scale.
Table 3. Mean vertical root distribution coefficient, β, and root fractions in the soil top 30 cm (RFTop30cm) across the moraines of the study sites
Figure 4. Vertical distribution of (a), (b) root mass and (c), (d) root length across the moraines (see ) of the (a), (c) Stein Glacier and (b), (d) Griess Glacier forelands. The vertical root distribution was fitted using the model proposed by Gale and Grigal (Citation1987). The resulting β coefficients are shown in . The cumulative root fraction represents the percentage of roots from the soil surface to the depth considered relative to the total roots of the soil profile. Models are plotted showing the 95 percent confidence intervals.
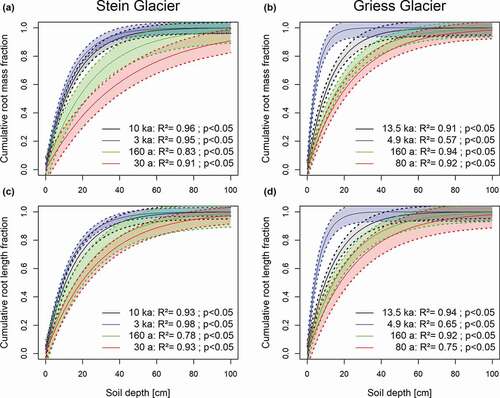
Table 4. Mean BGB, AGB, and R:S ratio across the moraines of the study sites
Figure 5. AGB, BGB, and R:S ratio across different moraines and the relationships between AGB and BGB of (a), (c), (e), (g) Stein Glacier and (b), (d), (f), (h) Griess Glacier forelands. A post hoc LSD test was conducted to compare biomass measures among the moraines. The significance level was adjusted according to the Bonferroni method. Superscript letters indicate significant differences.
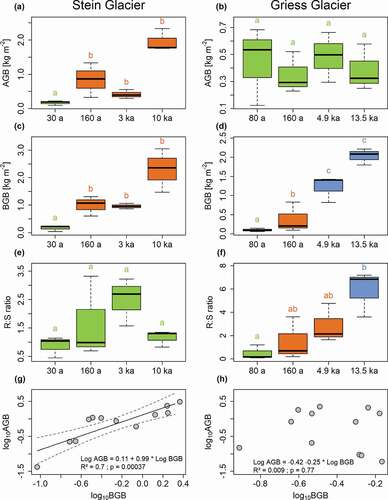
Table 5. Pearson correlation coefficients of vertical root distribution coefficients and vegetation composition