
Figures & data
Figure 1. Study area near Quito, Ecuador. White lines delineate areas above 3,500 m used in land use and land cover classification and subsequent C stock calculations. Black rectangles show sites of soil sampling. Rectangle S represents sampling site Sincholagua, A is sampling site Antisana, and P is sampling site Piedras Blancas. Map projection is WGS 1984/UTM 17 N.
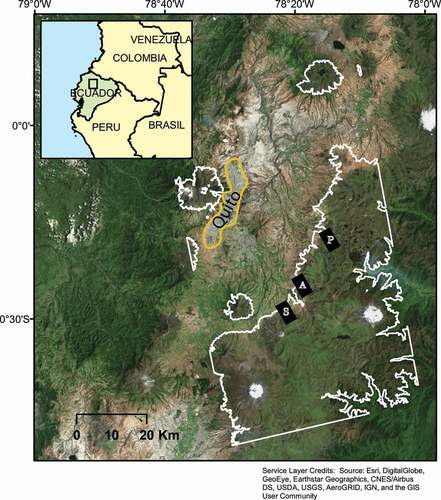
Figure 2. Average soil C content for each land use type and soil profile depth. Error bars represent ±1 SE.
Figure 3. Relationship between time since initial cultivation and soil %C for all land use types.
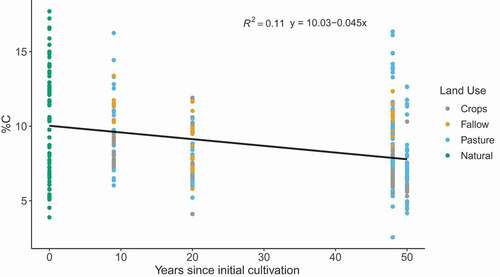
Figure 4. Average bulk density and C stocks for each land use type and soil profile depth. Error bars represent ±1 SE.
Table 1. Confusion matrix of land use classification accuracy assessment
Table 2. Percentage of study area in each LULC category in 1991, 2002, and 2017
Figure 5. Land cover and land use classification of páramo surrounding Quito, Ecuador, in 1991, 2002, and 2017.
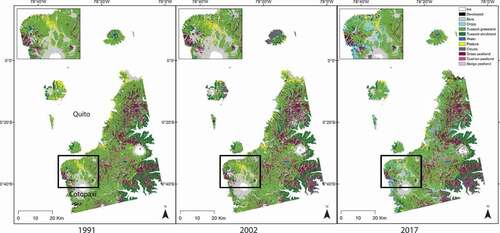
Table 3. Transition pathways from natural vegetation types to agricultural uses