Figures & data
Figure 1. Study site during penitentes formation. The 14-m borehole in the foreground and 40-cm active layer monitoring site farther behind about 5 m apart (photo taken on 10 January 2019).
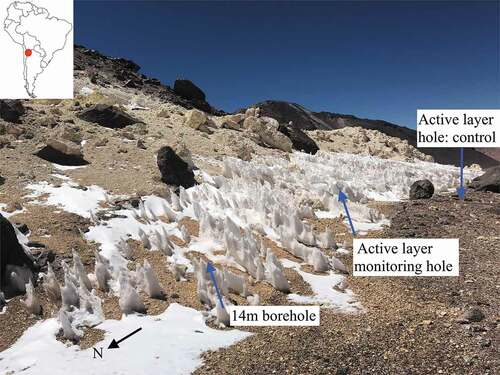
Figure 2. Permafrost and active layer temperature profiles every other month. Plotted are monthly borehole temperatures at 0, 0.5, 1, 2, 3, 5, 10, and 14 m depth and maximum and minimum profiles from the surface to 39 cm depth, January to December 2019. Maximum and minimum active layer temperature profiles are shown on the right side for January (black line), April (gray line), and July (blue line) 2019. Mean annual ground temperature is plotted with solid black circles with a red line. MAGT = mean annual ground temperature.
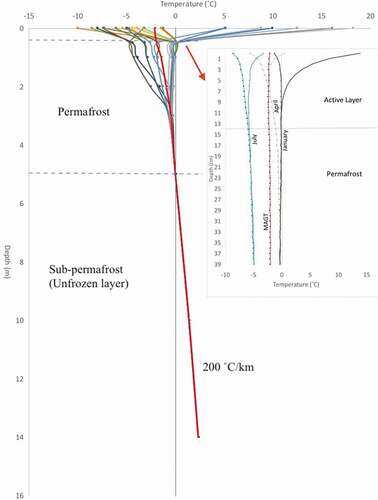
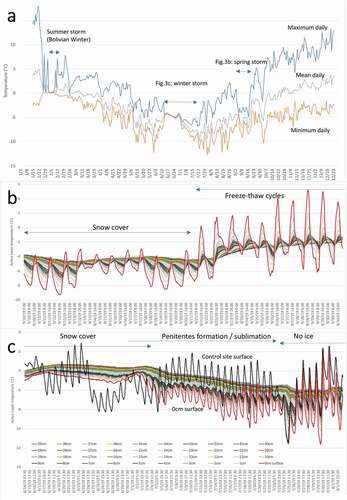
Figure 3. Active layer dynamics for the year 2019 and for each snowstorm event. (a) Mean, maximum, and minimum daily surface temperature profiles, January to December 2019. (b) During summer snow storm, profiles of the upper 40 cm (1-cm intervals) temperatures at 30-minute logging intervals (red solid line indicates ground surface temperature), 29 January to 13 February 2019. (c) During winter snow storm, profiles of upper 40 cm (1-cm intervals) temperatures at 30-minute logging intervals (red solid line indicated ground surface temperature), 14 June to 1 August 2019.