Figures & data
Figure 1. (a) Lake Tarfala, with color-coded high-resolution bathymetry from Kirchner et al. (Citation2019) overlain on orthophoto Rgb050 (GSD 2+ elevation data, Lantmäteriet Citation2015), showing also the terminus of Kebnepakteglaciären, formerly terminating in the northwestern part of Lake Tarfala. Lake level (yellow stippled line) is at 1,162 m.a.s.l. White dots mark mooring sites M1 and M2. At M1, water temperature has been measured at various depths in the water column since 2016. The white diamond marks the site L1 where a StarOddi CTD sensor was moored. (b) The Tarfala area on a regional overview map from Google Earth (image: 10 August 2013) with Lake Tarfala (Tarfalasjön, abbreviated TS) in the center. Red dot marks the location of TRS. Storglaciären (SG), Isfallsglaciären (IG), and Kebnepakteglaciären (KG) are marked, as well as Sydöstra Kaskasapakteglaciären (SÖ KPG), Sydvästra Kaskasatjåkkaglaciären (SV KTG), and Sydöstra Kaskasatjåkkaglaciären (SÖ KTG). Note that Tarfala Bridge is located outside of the area shown in (b). (c) Location of the Tarfala area in northern Sweden (image from Google Earth).
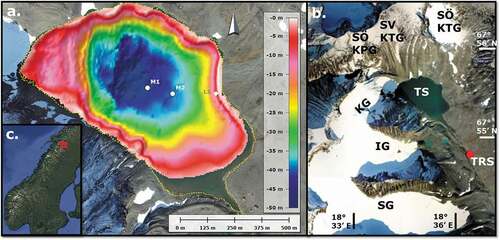
Figure 2. Water temperatures in Lake Tarfala. Colorscale ranges from blue (cold, 0°C) to red (warm, 6.5°C). Temperature data are plotted at a temporal resolution of 2 hours (SBE56 data were downsampled to match the temporal resolution of the HOBO sensor data). Note that no interpolation was carried out in the vertical (implying that water temperatures shown between, e.g., 40 and 31 mbls are the water temperatures measured at 40 mbls and that those shown between 30 and 21 mbls are the temperatures measured at 30 mbls, etc.). (a) Water temperature at various depths (40, 30, 20, 10 mbls) during the period 18 September 2016 to 5 September 2019 at mooring site M1 (see ), based on data acquired every 30 minutes with the exception of a 36-hour maintenance period 18–20 September 2017) by a vertical array of SBE sensors. White cells denote unavailable data in the uppermost water layers prior to April 2019. Black solid frame in the upper right corner denotes depth–time snippet shown in (b). Black stippled frames indicate depth–time regions shown in and S1. (b) Water temperatures at depths of 8, 6, 4, and 2 mbls during the period 28 April 2019 to 5 September 2019 based on data acquired every 120 minutes by HOBO sensors attached to the mooring at M1.
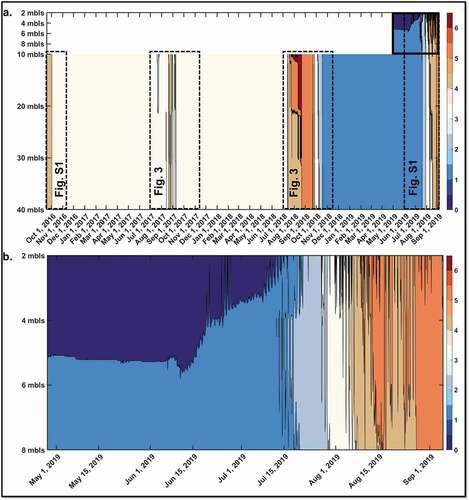
Figure 3. Average daily water temperature and its variation with depths at selected dates during (a) 2017 and (b) 2018 (cf. also ). Profiles during winter stratification, warming, spring overturning, and summer stratification are denoted with stippled lines. Profiles during cooling and arrival at the following years’ winter stratification are denoted with solid lines. Values between depths where water temperature has been acquired (indicated by the lables on the y-axes) are interpolated.
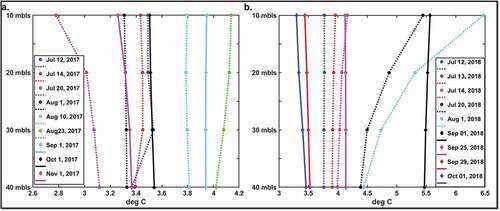
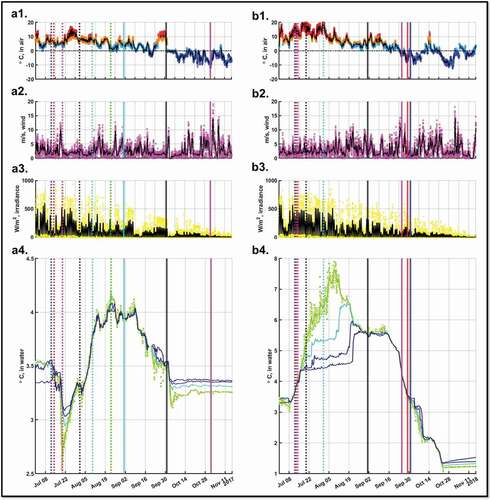
Figure 4. Synopsis of weather conditions recorded at TRS and lake water temperatures for the period 1 July–15 November 2017 (panels (a1)–(a4)) and 2018 (panels (b1)–(b4)). Vertical colored (stippled and solid) lines mark dates for which selected temperature profiles are presented in . Panel 1: Air temperatures. Panel 2: Wind speed. Panel 3: Solar irradiance. Black solid lines in Panels 1, 2, and 3 denote 12-hour moving averages. Panel 4: Lake water temperature. (a4) and (b4): Water temperature at 10 mbls (green dots, 2-hour resolution; light green line, 12-hour moving average), 20 mbls (turquoise line, 12-hour moving average), 30 mbls (light blue line, 12-hour moving average), and 40 mbls (dark blue line, 12-hour moving average).