Figures & data
Figure 1. Thaw ponds of the Arctic Coastal Plain, Alaska: (a) low centered polygon (LCP) ponds form at the depressed centers of polygonal ground and trough ponds form above thawing ice wedges in cracks between polygons, (b) larger ponds form when permafrost thaws and multiple ponds of varying types coalesce, and (c) an emergence trap is positioned at the center of an LCP pond. All thaw ponds were sampled from a single study area indicated by the ♦ on the map of Alaska.
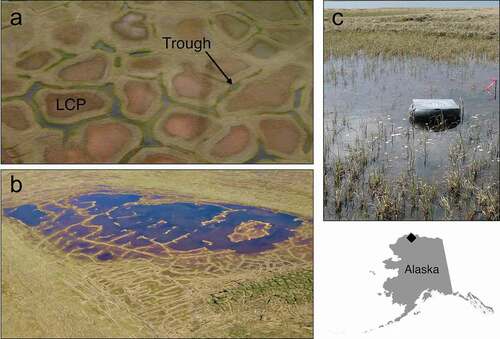
Table 1. Total number of floating insect emergence traps deployed in pond centers and margins of the different pond classes during summer 2012 and 2013
Table 2. AICc scores and percentage deviance explained for the three competing models of insect emergence phenology in tundra thaw ponds
Figure 2. Predicted mean density of emerging insects from (a) LCP, (b) large coalescent, (c) small coalescent, and (d) trough ponds during the 2012 and 2013 growing seasons. Peak emergence occurred on DoY 188 (6/7 July). Shaded bands represent ±2 standard errors around the mean.
Table 3. Mean density (number/m2/d) and standard error (SE) of emergent insect families captured in arctic thaw ponds during the growing seasons in 2012 and 2013
Figure 3. Mean density of emerging insects by origin: terrestrial, semiaquatic, parasitic, and aquatic. Mean density was determined by averaging the standardized abundance from all traps collected during the 2012 ((a) pond center, (b) margin) and 2013 ((c) pond center, (d) margin) growing seasons. No data were available for trough (TR) pond margins in 2012 or large coalescent (LC) pond margins in 2013. SC = small coalescent.
Figure 4. Ordination plots, on three dimensions, of insect communities emerging from arctic thaw ponds in early July. Points represent communities in each of the different pond classes (LCP, small coalescent, large coalescent, and trough) and habitats (open symbols = center and filled symbols = margin) collected over ten days in 2013. Points closer to one another represent communities that are more similar. The proximity of the insect family name to a point indicates greater abundance and association to that pond/habitat. The arrows and labels represent the environmental vectors (p < 0.10) associated with the axes of the emergent insect communities. Length of the arrow is related to the strength of the relationship. Insect families are Cera = Ceratopogonidae, Chir = Chironomidae, Culi = Culicidae, Ephy = Ephydridae, Musc = Muscidae, Myma = Mymaridae, and Scia = Sciaridae.
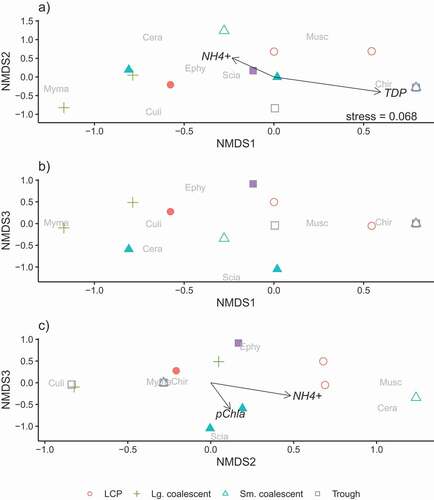
Figure 5. Ordination plots of insect communities emerging from arctic thaw ponds in mid-July. Points represent communities in each of the different pond classes (LCP, small coalescent, large coalescent, and trough) and habitats (open symbols = center and filled symbols = margin) collected over ten days in 2013. Points closer to one another represent communities that are more similar. The proximity of the insect family name to a point indicates greater abundance and association to that pond/habitat. The habitat centroids for pond center (C) and margin (M) are shown when the factor is associated with the emergent insect communities (p < 0.10). Insect families are Brac = Braconidae, Ceci = Cecidomyiidae, Cera = Ceratopogonidae, Chir = Chironomidae, Culi = Culicidae, Ephy = Ephydridae, Ichn = Ichneumonidae, Myma = Mymaridae, and Scia = Sciaridae. Sciaridae and Mymaridae were staggered slightly on the first and third axes (b) to reduce overlap and improve legibility in the figure.
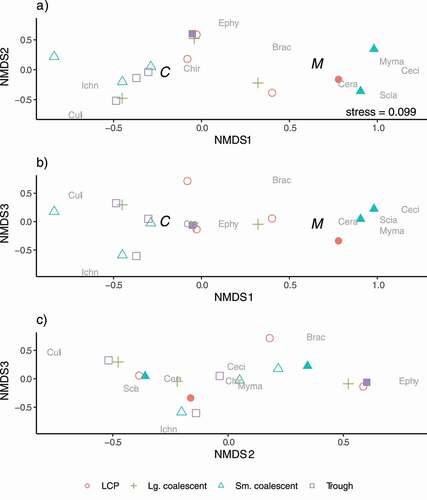
Figure 6. Ordination plots, on three dimensions, of insect communities emerging from arctic thaw ponds in late July. Points represent communities in each of the different pond classes (LCP, small coalescent, large coalescent, and trough) and habitats (open symbols = center and filled symbols = margin) collected over ten days in 2013. Points closer to one another represent communities that are more similar. The proximity of the insect family name to a point indicates greater abundance and association to that pond/habitat. The habitat centroids for pond center (C) and margin (M) are shown when the factor is associated with the emergent insect communities (p < 0.10). The arrows and labels represent the environmental vectors (p < 0.10) associated with the axes of the emergent insect communities. Length of the arrow is related to the strength of the relationship. Insect families are Brac = Braconidae, Ceci = Cecidomyiidae, Chao = Chaoboridae, Chir = Chironomidae, Ephy = Ephydridae, Ichn = Ichneumonidae, Limn = Limnephilidae, Musc = Muscidae, Myma = Mymaridae, and Scia = Sciaridae. Sciaridae and Muscidae were staggered slightly on the first and second axes to reduce overlap and improve legibility in the figure.
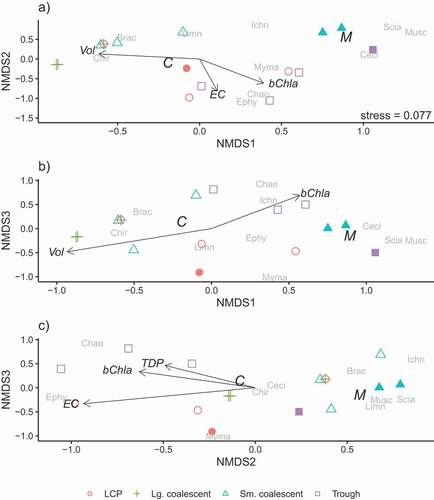
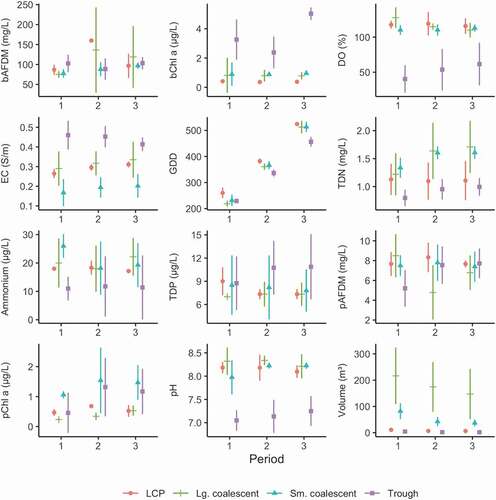
Figure 7. Mean with standard deviation of the ten-day average value for environmental variables during three ten-day time periods collected in July 2013 in each of the pond classes. Variables include bAFDM, bChla, DO, EC, GDD, TDN, NH4+(Ammonium), TDP, pAFDM, pChla, pH, and volume.