Figures & data
Figure 1. Oblique view of Kilimanjaro and the study sites (Google Earth). Site abbreviations correspond with site names in .
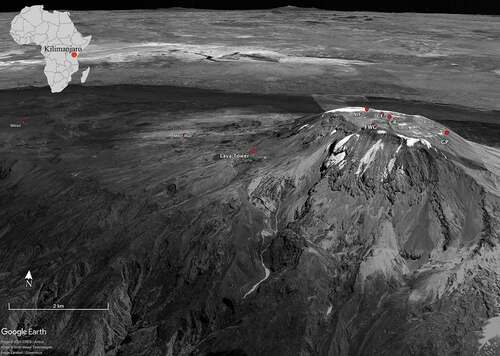
Figure 2. Nieve (snow) penitentes developed within Kibo caldera, near NIF monitoring site (5 October 2007).
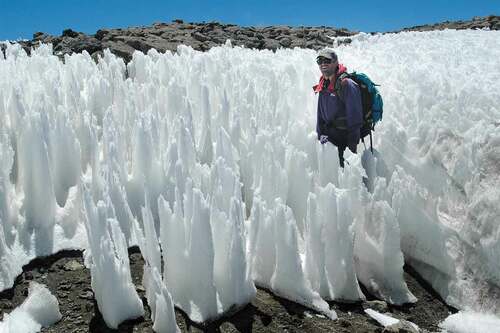
Figure 3. Location map of borehole monitoring sites within the summit caldera in January 1938 aerial photograph. Site abbreviations correspond with site names in . The NIF and FWG are readily distinguished from adjacent snow cover, due to the near-vertical ice margins. (University of Wisconsin–Milwaukee Library Li000958).
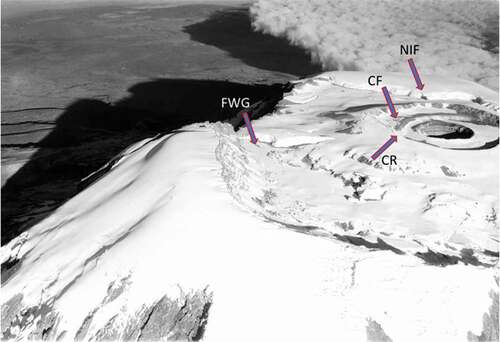
Figure 4. Buried relict ice of Little Barranco Glacier at ~4,900 m southeast of Arrow Glacier camp, typical of that found elsewhere on the western slopes of Kilimanjaro.

Figure 5. Indirect evidence for basal ice melting, due to spatially variable geothermal heat: (a) deformation of stratigraphy at the NIF borehole site, 29 September 2012; (b) deformation of Furtwängler Glacier stratigraphy near the FWG site, 3 September 2009; and (c) basal dome formed above vent at FWG, 25 September 2012. Red lines indicate expected stratigraphy in the absence of basal melting, roughly parallel to the caldera surface.
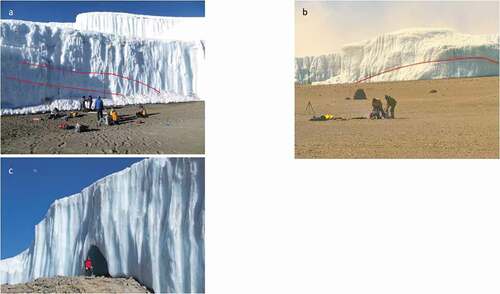
Table 1. Borehole locations and details. All measurements made by thermistor and recorded at 60-minute intervals with Onset dataloggers, except at Northern Icefield (Data Garrison). Site abbreviations correspond with labels in and 3. Dark shading indicates sites with measurements at one-meter depth
Figure 6. Mean air and ground temperatures at sites on Kilimanjaro south slope. Air temperature is at screen level (~1.5 m) for September 2004 to January 2006 (Duane et al. Citation2008, table 2). Ground temperatures (1-m depth) are from sites shown in , October 2009 to September 2012.
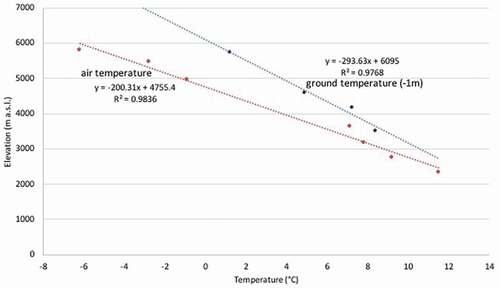
Figure 7. Borehole temperatures of the FWG at depths of 1, 2, and 3 m and maximum and minimum ground temperature profiles (e.g., trumpet curves), constrained by 0.02-m depth temperatures and smoothed to 1-m depth based on thermal conductivity, October 2009 to September 2010.
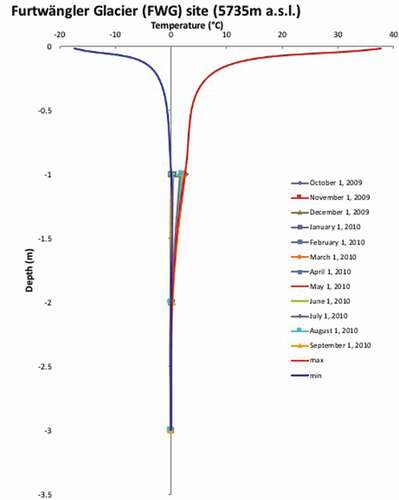
Figure 8. Snow height and ground temperature patterns at the FWG monitoring site, October 2009 to September 2012. Top plot (a) shows changes in surface height on upper (black line) and lower (red) Kersten Glacier (half-hourly), along with daily Northern Icefield heights as the thin red line with short-rain (green) and long-rain (blue) seasons each year (all in meters, arbitrary datum). Shown on this line as cyan/blue circles are eight times for which photographs of caldera snow cover are available. Middle panel (b) is FWG site ground temperatures at depths of 1, 2, and 3 m (pink, orange, and red; all in degrees Celsius). Bottom panel (c) is four-hourly FWG surface temperature (°C). Vertical lines (cyan) align the timing of selected snowfall events (see text).

Figure 9. Temperature patterns recorded at a ground depths of 0.5 and 1 m at the NIF monitoring site, September 2012 to September 2013.
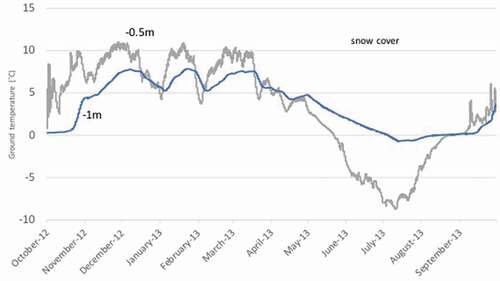
Figure 10. Nighttime thermal images within Reusch Crater, 28 September 2012 at 22:00, showing (a) ash pit and Reusch Crater wall behind and (b) Reusch Crater outer rim. Also shown is daytime view of Reusch Crater and inner ash pit, looking approximately to the northeast direction.
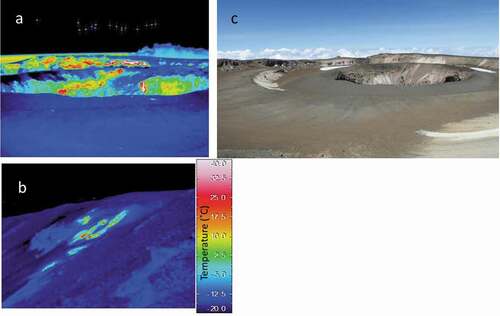
Figure 11. Hourly mean ground temperatures at 1-m depth for five sites, September 2010 to August 2012.
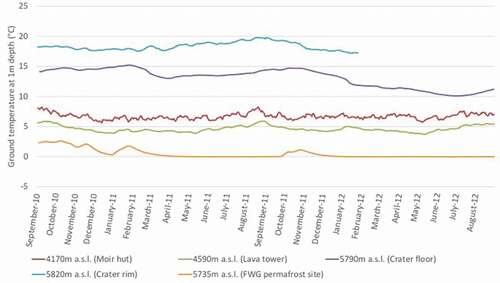
Figure 12. Hourly mean ground surface temperature through the study interval at three different elevations, September 2010 to September 2012. Temperature at all sites reached subfreezing and strongly fluctuated when the sites were snow-free. Crater rim site at 5,820 m.a.s.l. (gray: left y-axis) had frequent snow cover, especially between October 2011 and June 2012. Moir hut (4,170 m.a.s.l.; green: right y-axis) sometimes not freezing overnight but Lava Tower site at 4,590 m.a.s.l. (brown: right y-axis) had severe freeze–thaw cycles almost daily. Note that the illustrated time interval began one year later than that of other plots.
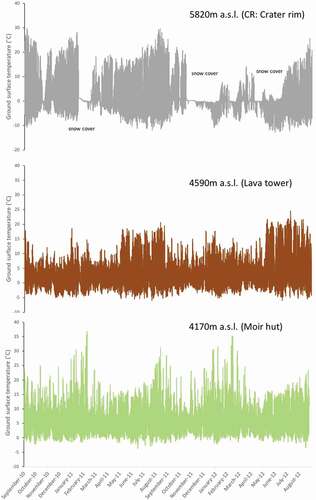
Table 2. The frequency of the “normal” and “effective” freeze–thaw cycles at each site
Figure 13. Examples of freeze–thaw impacts, including (a) patterned ground at 4,170 m.a.s.l., (b) stone stripes at 4,590 m.a.s.l., (c) surface pattern due to needle ice at 4,700 m.a.s.l., and (d) stone stripes at 5,735 m.a.s.l.
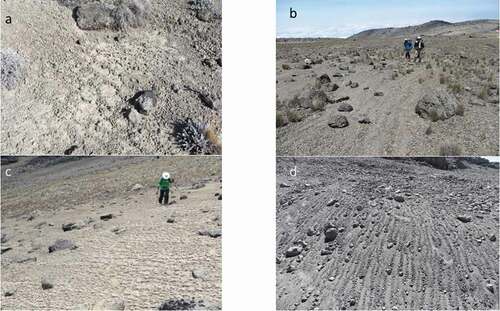
Figure 14. Monthly mean air temperatures (°C) on the Northern Icefield through the study period (line, left-hand y-axis) and standardized deviations of air (dark bars) and glacier surface temperatures (light bars) for each month in degrees Celsius (right-hand y-axis for both; 2004–2020 reference period).
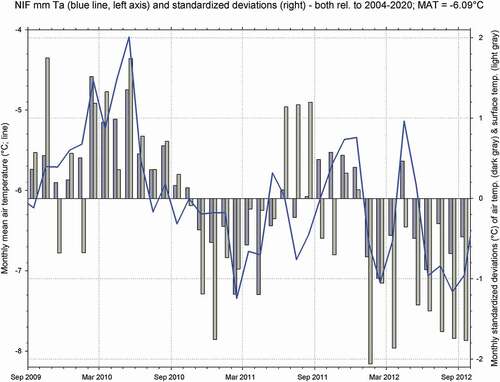
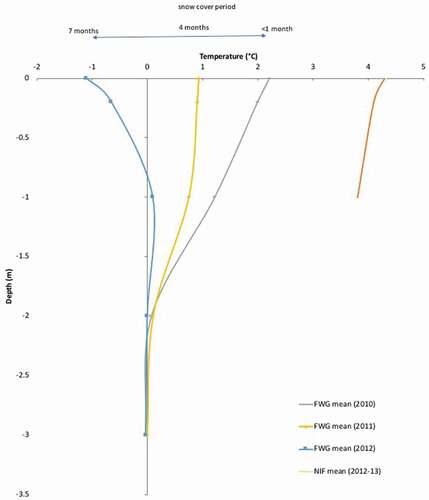
Figure 15. Kilimanjaro ground temperature profiles from FWG and NIF drill sites, governed by the period of snow cover (top).