
Figures & data
Figure 1. Map showing sediment core locations (white circles, bold text) and lake regions in Lhù’ààn Mân’ (Kluane Lake; red square, inset map), southwestern Yukon Territory. The communities of Burwash Landing and Destruction Bay and the Kluane Lake Research Station are indicated with gray squares. Other places mentioned in this study are indicated using traditional Southern Tutchone place names and settler English names. Base map data: CARTO Voyager.
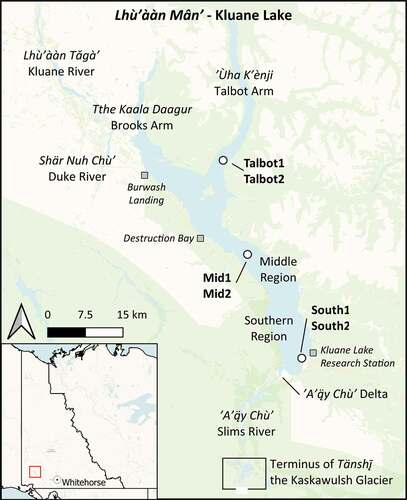
Table 1. Analyses completed in sediment cores collected from the southern arm, the middle region, and the Talbot Arm of Kluane Lake
Figure 2. Age–depth relations for core Mid2 (A, top) and core Talbot1 (B, bottom) from Kluane Lake, developed using Bacon, and radioisotope activity plots (inset). Radiocarbon dates were calibrated using IntCal13 (Reimer et al. Citation2013) and are plotted in blue. CRS model dates and marker layers (including the 1899 CE Yakutat Earthquake and formation of the Kluane River in 1690 CE and the White River tephra layer 803 CE) are plotted in teal. The weighted mean age–depth model is plotted with a red dashed line, the 95 percent confidence intervals are plotted as a gray dotted line, and the Markov chain Monte Carlo iterations for each section age are plotted as a black cloud (darker black represents a higher frequency of occurrence). Ages are plotted as calendar years before present (before 1950 CE). See Blaauw and Christen (Citation2011) for more information on Bacon age–depth modeling.
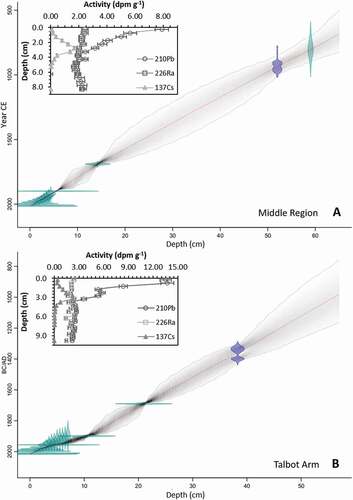
Figure 3. Stratigraphic plots showing temporal variation of measured variables in sediment cores Mid2 (top) and Talbot1 (bottom) collected from the middle region and Talbot Arm of Kluane Lake. Mercury accumulation on Mt. Logan reconstructed from an ice core (locally estimated scatterplot smoothing smoothing) is shown on the right in medium blue (modified from Beal et al. Citation2015). The Duke River period is shown with gray shading; the Slims River period is not shaded. The blue solid line represents the formation of the Kluane River (1690 CE; Clague et al. Citation2006). The orange dashed line represents a major sediment disturbance event in 1899 CE.
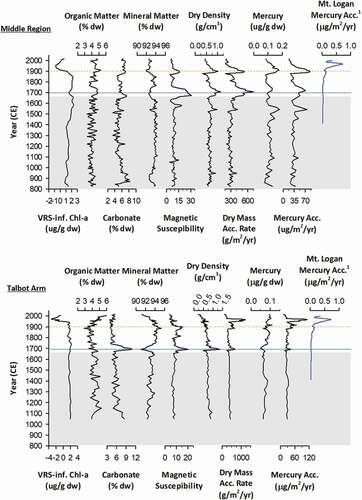
Table 2. Mean (SD) Hg concentration, Hg accumulation rate, dry mass accumulation rate, organic content, carbonate content, mineral content, VRS-inferred chl-a concentration, and magnetic susceptibility in cores Mid2 and Talbot1 during the Duke River period and the Slims River period
Table 3. Significant correlations in cores Mid2 and Talbot1 during the Duke River period and Slims River period between Hg concentration and other paleolimnological variables and between dry mass accumulation rate and other paleolimnological variables