
Figures & data
Figure 1. Trends in mean surface air temperature over the period 1960 to 2019. Notice that the Arctic is red, indicating that the trend over this 60-year period is for an increase in air temperature of nearly 4°C (7.2° F) across much of the Arctic, which is larger than for other parts of the globe. The graph in part b presents linear trends over the period by latitude. – Credit: NASA GISS.
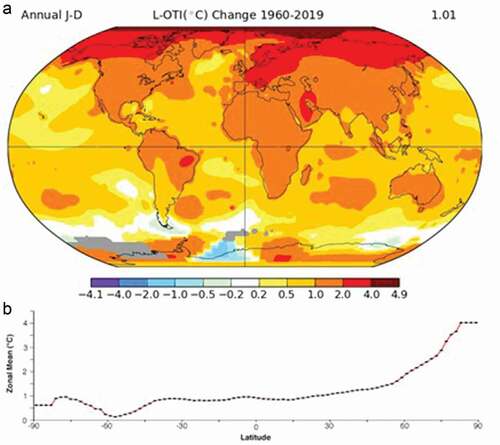
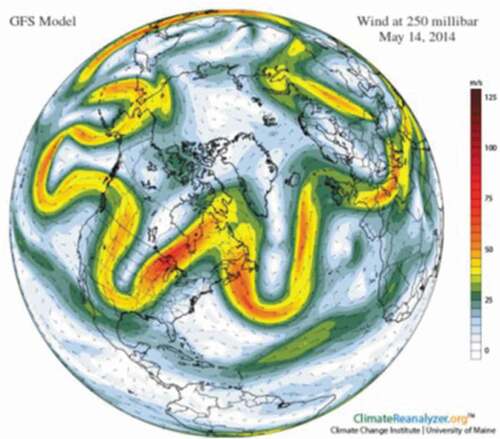
Figure 2. Wandering jet stream on May 14, 2014. Colors represent wind at 250 millibars from the GFS Model. (Credit: Climate Change Institute).
Supplemental material