
Figures & data
Figure 1. Maximum area of Greenland that experienced surface melt, 1979–2020 (Courtesy: M. Tedesco).
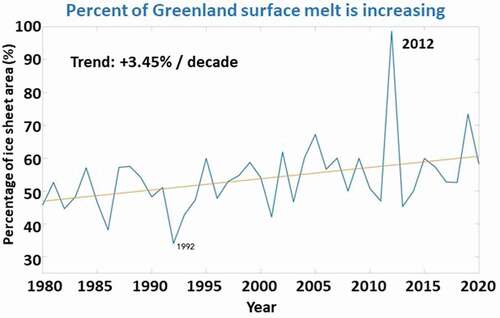
Figure 2. Meltwater runoff between 1950 and 2020 (relative to mean from 1960 to 1990) accumulated over the ice sheet, as simulated by an atmospheric regional model (MAR). (Courtesy: M. Tedesco).
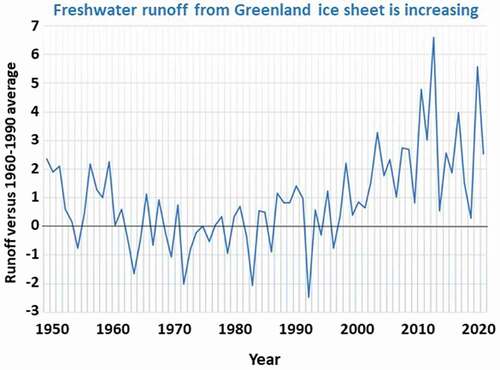
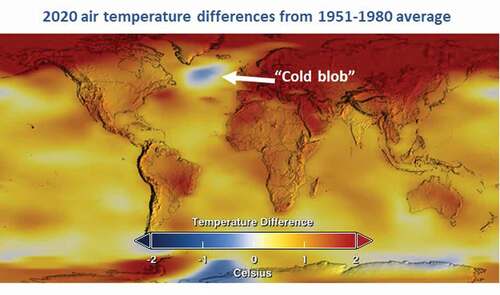
Figure 3. Near-surface temperature differences (in oC) for 2020 relative to average from 1951–1980. Figure from NASA at https://svs.gsfc.nasa.gov/4882.
Supplemental material