
Figures & data
Table 1. Summary of annual experimental treatments in birch mesic tundra vegetation near Daring Lake that were initiated in 2004 in randomly allocated plots (5 m × 7 m) at five replicate plots per treatment and assayed in triplicate for this study
Figure 1. Average relative abundances of phyla in bulk soil and birch rhizosphere within each experimental treatment group for both the (a) bacterial and (b) fungal communities of low Arctic mesic birch hummock tundra. Sequence results analyzed to phylum level for (a) bacterial communities and (b) fungal communities in bulk soil and rhizosphere. The relative abundances shown represent the average of treatment replicates (n = 5), with treatment groups indicated on the x-axis. Any phyla present at less than 0.1 percent relative abundance across all treatment groups were pooled together.
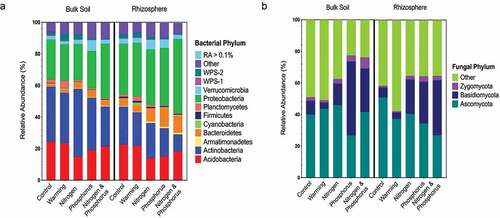
Figure 2. Average relative abundances of taxa (family or genus) in bulk soil and birch rhizosphere within each experimental treatment group for both the (a) bacterial and (b) fungal communities of low Arctic mesic birch hummock tundra. Sequence results were analyzed to family level for (a) bacterial communities and genus level for (b) fungal communities in bulk soil and rhizosphere. The relative abundances shown represent the average of treatment replicates (n = 5), with treatment groups indicated on the x-axis. Any taxa present at less than 1 percent relative abundance across all treatment groups were pooled together for both the fungal and bacterial microbiomes.
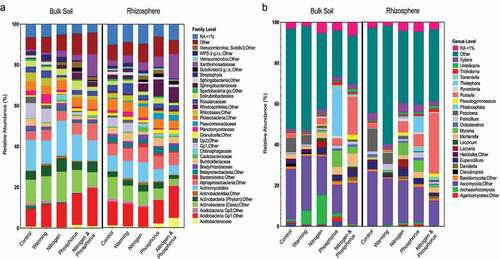
Figure 3. Phylogenetic and ecological diversity in bulk soil and birch rhizosphere microbial communities in arctic mesic birch soil for each experimental treatment group. (a) Average alpha diversity was calculated for bacterial diversity using PD and Shannon index—that is, the combination of richness plus evenness (SD)—and (b) fungal diversity was calculated using the Chao1 index and Shannon index (SD; n = 5). Asterisks indicate that the treatment group was significantly different from controls (p < .05). No significant relative abundance differences were found between treatments in fungal communities (p > .05) .
Table 2. Analysis of similarities (ANOSIM) and of differences (adonis) between the bulk soil and birch rhizosphere beta diversity values for the bacterial and fungal communities across all experimental and control plots described in this study
Figure 4. Beta diversity of samples is shown with NMDS plotted with fitted environmental variables for bacterial taxa in (a) bulk soil and and (b) birch rhizosphere communities using the weighted Unifrac metric and fungal taxa in (c) bulk soil and (d) birch rhizosphere using the Bray-Curtis metric. Environmental vectors are pointed in the direction of greatest change, with the ellipses representing the standard error from the centroid of each treatment group cluster. Treatment groups are indicated by the legend at the bottom, with environmental variables including nutrient concentration and pH as shown. Note that all samples were CSS normalized prior to beta diversity calculations. Red arrows indicate significant correlation of environmental variables (p < .05) with beta diversity when fitted using vegan (R package) .
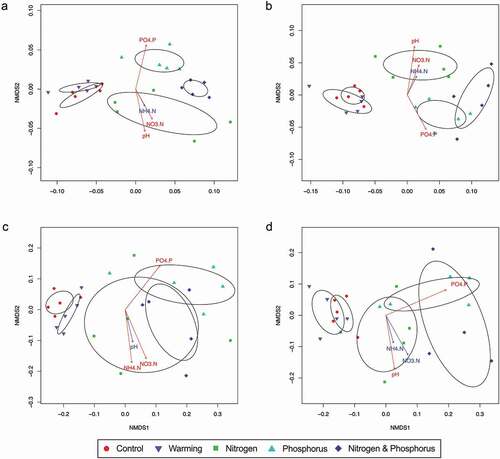
Table 3. Mantel tests results for only the significant correlations between beta diversity and biogeochemical properties at Daring Lake experimental plots in this study