Figures & data
Figure 1. (A) Position of the Colville River in the North Slope of Alaska and the (B) sample sites in the Colville River Delta are shown. Locations of water sampling and temperature measurement on 21 September 2018 are indicated as green dots. Data loggers were placed at locations 1, 4, and 5. Inset table summarizes locations and dates of periodic water temperature measurement.
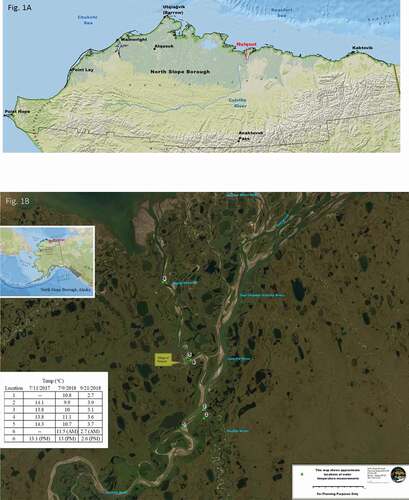
Figure 2. The plate illustrates an Alaska sample held at 4°C and 0 percent salinity; the colored concentric circles represent the sequential growth front for measuring perimeter, and the solid yellow lines are north–south, east–west radials (length) used to estimate perimeter.
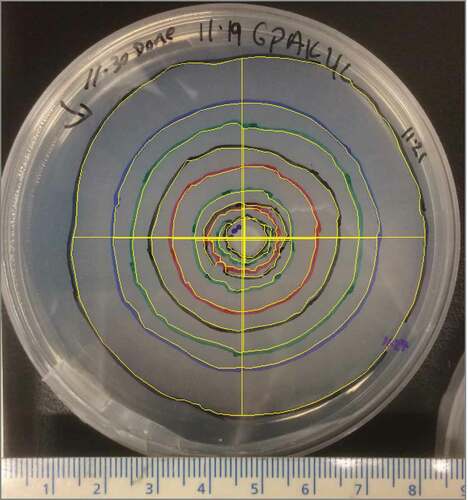
Table 2. The calculated rate of growth and inhibition of growth based on the model Equation (1)
Figure 3. Water temperature (°C) measurements from July to September 2018 for three data loggers located (see ) in the Colville River (green line, location 1) or in the Niġliq Channel (blue and red lines, locations 4 and 5, respectively).
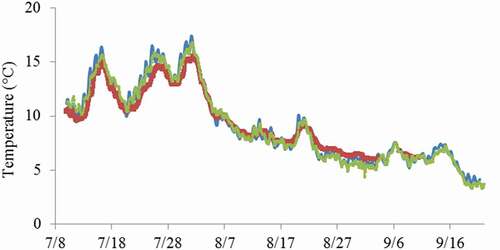
Table 1. Posterior medians and 95 percent posterior credible interval bounds for parameters associated with fixed effects in our model
Figure 4. Colony growth (perimeter) for AK (black) and BC (red) S. parasitica isolates over time (h), for a range of temperatures (°C) and salt concentrations (% w/v). Each curve represents the results from one plate for which there were four replicates per temperature–salt concentration per isolate.
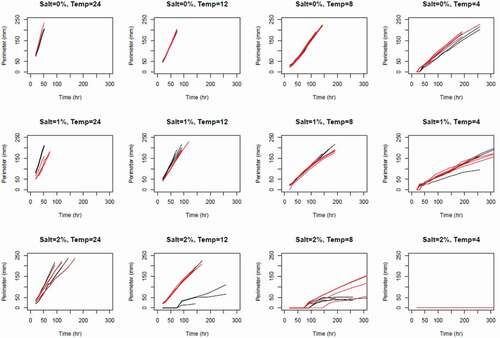
Figure 5. Lines represent posterior predictive 95 percent intervals for AK (black) and BC (red) perimeter (mm) at 48 hours by temperature (°C), conditional on the random effects.
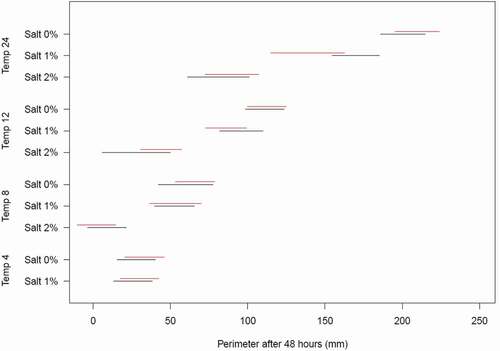
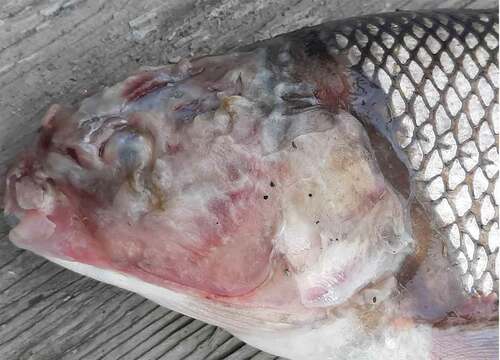
Figure 6. Photo of fish taken in Nuiqsut in late July 2020. To the best of our knowledge, this is the first reported fish with putative saprolegniosis found outside of the time period (September–October) when saprolegniosis has typically been observed on this species (Sformo et al. Citation2017). Photo by Jerry Lee Pausanna. Used with permission.