Figures & data
Figure 1. (a) Location map. The Malan Glacier on the Tibetan Plateau showing the ice core site. The glacier outlines were delineated manually using Landsat TM data from 1999, in conjunction with digital elevation model data from 2000 (USGS Citation2021). (b) The Malan Glacier borehole temperatures (dots) measured in 1999 and the steady state calculated at the annual influence depth of 15 m (dashed)
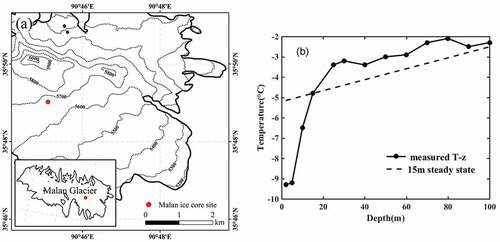
Figure 2. (a) Monthly mean air temperature at Wudaoliang meteorological station in 1998 (black dots) and 1999 (red dots). (b) T–z profiles for the steady state (dashed) and the yearly temperature oscillations using monthly mean air temperature data from 1998 (black line) and 1999 (red line). The 15-m-deep temperature oscillations were 0.05°C in 1998 and 0.09°C in 1999, and both were less than 0.1°C
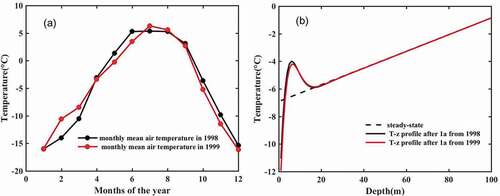
Figure 3. (a) L-curve for the Tikhonov regularization. was about 0.016, corresponding to the corner of the curve. (b) The GST variations from the initial steady-state temperature in the last century reconstructed from Malan borehole temperatures. (c) The GST history (black line) and the reconstructed solution by the Tikhonov regularization (red line). (d) The deviations (dots) between the measurements and the calculated T–z profile
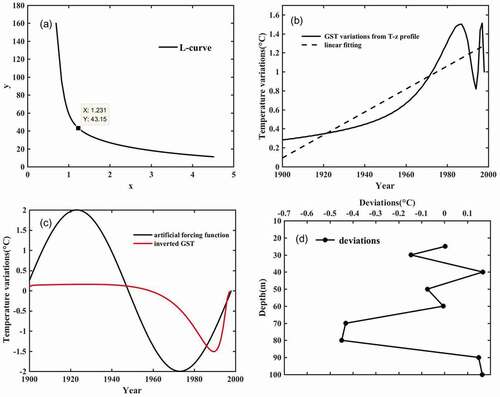
Figure 4. (a) T–z profiles from measurements (black) and after smoothing (red). (b) The reconstructed GST histories from measurements (black line) and after smoothing the T–z profile (red line). The blue dashed line plots the linear fitting for the GST changes after smoothing the T–z profile
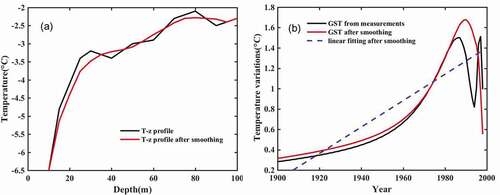
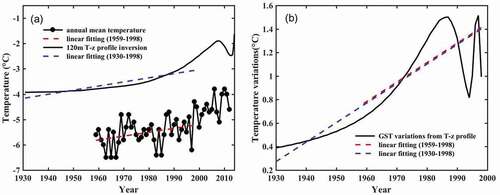
Figure 5. (a) Upper: the reconstruction based on the 120-m permafrost borehole drilled in 2012 (borehole temperatures measured in 2013) at Wudaoliang, along with the linear fitting from 1930 to 1998 (blue dashed line). (a) Lower: annual mean air temperature (dots) from 1959 to 2012 collected by Wudaoliang meteorological station and the linear fitting from 1959 to 1998 (red dashed line). (b) The reconstructed GST variations (solid line) and the linear fitting from 1959 to 1998 (red dashed line), along with the linear fitting from 1930 to 1998 (blue dashed line)