Figures & data
Figure 1. Spring ice extent in the Bering Sea varies greatly from year to year. Years 2001 and 2018 had the least ice, and years 1976 and 2008 had the most. Figure courtesy of Phyllis Stabeno, NOAA, Pacific Marine Environmental Laboratory.
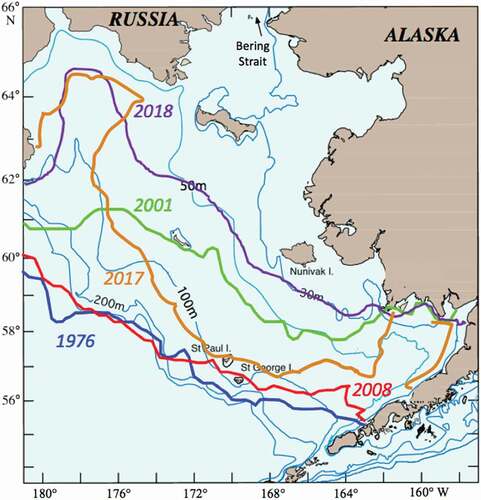
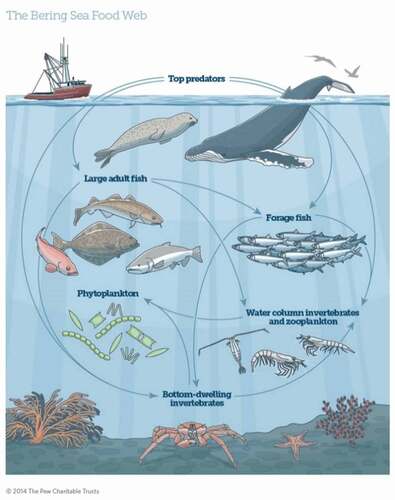
Figure 2. Commercial fish species found in the Bering Sea include six species of Pacific salmon, Alaska pollock, Pacific cod, Pacific halibut, yellowfin sole, Pacific ocean perch, and sablefish. Red king crab are also among the types of shellfish found. A healthy, balanced food web contributes to their overall number and distribution throughout the area. Copyright The Pew Charitable Trust, with permission. http://www.pewtrusts.org/-/media/assets/2014/10/ecosystem-based-fishery-management-in-the-bering-sea.pdf