Figures & data
Figure 1. Map of the Arctic Ocean (Jakobsson et al. Citation2012), with indication of core sites discussed in this study. AB = Amerasian Basin, EB = Eurasian Basin. Core names are abbreviated in the map; full core names are AO16-8GC (this study), LOMROG12-3PC, (O’Regan et al. Citation2020), and ARC3-B84A and ARC-B85A (Wang et al. Citation2018).
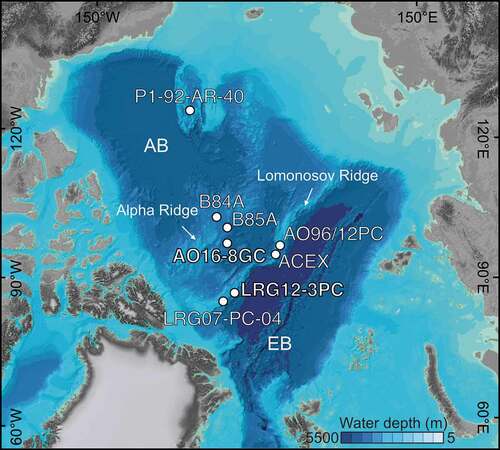
Table 1. Core sites discussed in this study
Figure 2. Core imagery (natural and optimized colors) and lithology of AO16-8GC, together with downcore changes in physical properties and variations in foraminiferal composition. Percentages of planktic foraminifera are calculated relative the total planktic foraminifer assemblage. P.F. = planktonic foraminifera. B. arctica = Bolivina arctica, O. tener = Oridorsalis tener, S. horvathi = Stetsonia horvathi, C. wuellerstorfi = Cibicidoides wuellerstorfi.
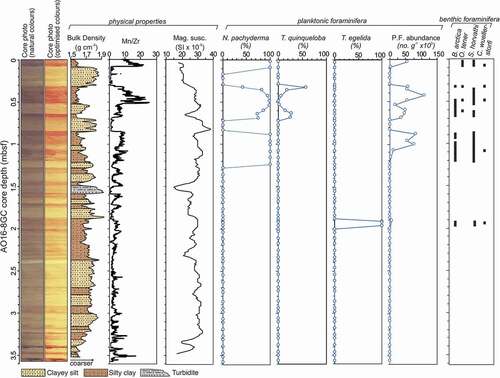
Figure 3. Presentation of two options for tying AO16-8GC to LOMROG12-3PC, leading to different MIS stratigraphies for AO16-8GC. Downcore variations in nannofossil composition of LOMROG12-3PC and planktonic foraminiferal composition and key benthic species of AO16-8GC are also presented. In option 1 (left), the T. egelida interval in AO16-8GC is correlated with the MIS 11 interval in LOMROG12-3PC. Dotted lines indicate the tentative correlation of lithologic units that follows from this. In option 2 (right), a coherent lithostratigraphic correlation between AO16-8GC to LOMROG12-3PC is presented. Tu = Turbidite. Correlation of LOMROG12-3PC to the well-studied cores AO96/12-1PC and ACEX can be found in O’Regan et al. (Citation2019, Citation2020).
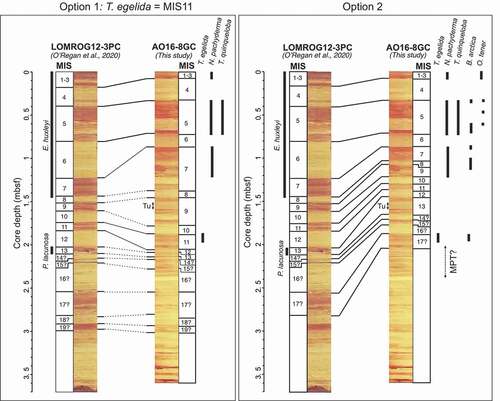
Figure 4. Comparison of downcore variability of physical properties between LOMROG12-3PC (red) and A016-8GC (blue). The measurements are plotted on a common depth scale according to correlation 1 (upper panels) and correlation 2 (lower panels).
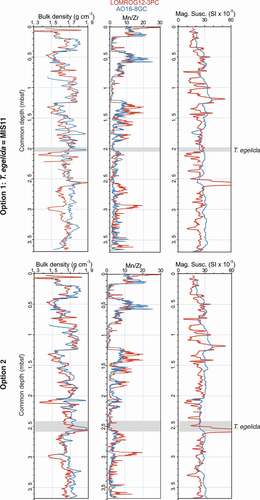
Figure 5. Comparison of the two options for tuning the Mn/Zr record of AO16-8GC to the LRO4 δ18O stack and derived sedimentation rates. In option 1 (upper panels), the T. egelida horizon is “set” to MIS 11. Tuning of the Mn/Zr in option 2 (lower panels) is done freely, without a priori age assumptions. Numbers within the plots indicate marine isotope stages.
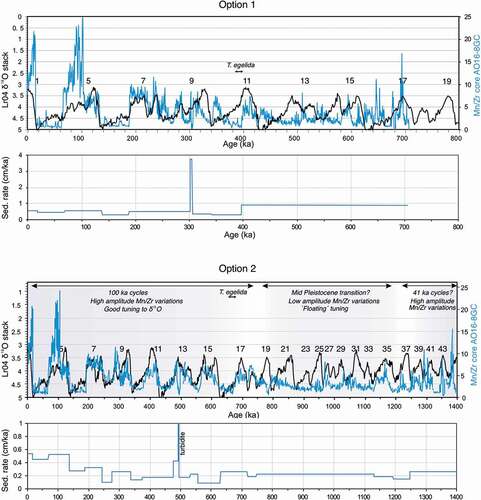
Plate 1. SEM images showing morphological variability of planktonic foraminifers found in AO16-8GC. (a) to (e): T. egelida (1.88–1.90 mbsf). Specimens (b) and (e) have a reduced final chamber. (f) to (j): T. quinqueloba (0.31–0.33 mbsf). (k) to (o): N. pachyderma; (k), (l), and (n) are from 0.10 to 0.12 mbsf. Specimen (n) represents a form without gametogenic calcite. (m) From 1.25 to 1.26 mbsf, (o) From 1.09 to 1.11 mbsf. Specimen (o) represents an aberrant form. Scale bar = 100 µm.
Plate 2. SEM images demonstrating wall texture differences between T. egelida and the weakly calcified N. pachyderma morphotype with which it can be confused. (a) to (d) The T. egelida morphotype with corresponding wall texture close-up views showing spine bases, with evidence of broken spines and/or spine holes still visible in some cases, sample AO16-9-PC1-3, 60 to 62 cm. (e) and (f) Weakly calcified N. pachyderma morphotype, having a wall texture with low pustules but no spines or spine bases, sample form the Eastern Fram Strait, ODP Site 986, 15.32 m, MIS 5e (sample provided by A. Zhuravleva/H. Bauch). (a), (c), (d) Scale bar = 100 µm. (b), (d), (f) Scale bar = 10 μm.
Plate 3. SEM images of the most common benthic foraminifers found in core AO16-8GC. a) C. wuellerstorfi (1.95-1.97 mbsf). (b) and (c) O. tener (0.48-0.50 mbsf). d) S. horvathi (1.95-1.97 mbsf). e) B. arctica (1.95-1.97 mbsf). Scale bars are 100 microns.