Figures & data
Figure 1. (a) Location map of Untersee Oasis in Dronning Maud Land (LIMA Landsat high-resolution virtual mosaic; Bindschadler et al. Citation2008); (b) Map showing the location of sampled ponds (background is a WorldView satellite image acquired 7 December 2017). The ponds are located on the west (blue dots) and east (red dot) lateral moraines of the Anuchin Glacier, the terminal moraine (yellow dots) and on the glacial diamicton a few meters above the eastern shore of Lake Untersee (green dots); (c) Map of Potential Incoming Solar Radiation (PISR; Wm-2) of the Untersee Oasis during the austral summer; (d) Hierarchical cluster plot of the ponds (based on their pH, total inorganic carbon, total organic carbon, PISR, δ18O, and D-excess values).
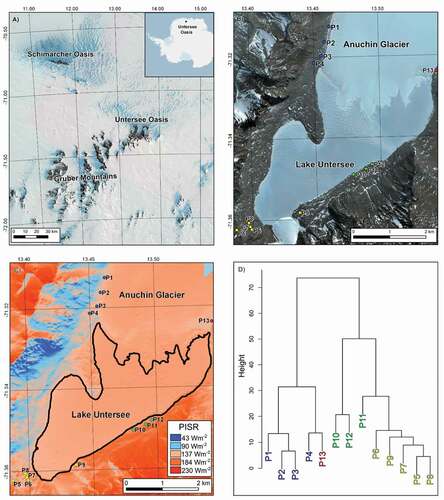
Figure 2. (a) Aerial photo of some ponds along the west lateral moraine. (b) Scatterplot of surface area (m2) and elevation of ponds in the Untersee Oasis. Note a negative relationship between pond elevation and surface for the west lateral moraine ponds (blue dots). (c) Scatterplot of the surface area (m2) and elevation relation for lakes and ponds in the McMurdo Dry Valleys (data from Lyons et al. [Citation2012] and Fountain et al. [Citation2017]). See for location of the ponds.
![Figure 2. (a) Aerial photo of some ponds along the west lateral moraine. (b) Scatterplot of surface area (m2) and elevation of ponds in the Untersee Oasis. Note a negative relationship between pond elevation and surface for the west lateral moraine ponds (blue dots). (c) Scatterplot of the surface area (m2) and elevation relation for lakes and ponds in the McMurdo Dry Valleys (data from Lyons et al. [Citation2012] and Fountain et al. [Citation2017]). See Figure 1 for location of the ponds.](/cms/asset/3232821e-0d06-40f2-bf9a-6defa61c7bcd/uaar_a_2000566_f0002_oc.jpg)
Table 1. Morphometric characteristics of ponds and their ice blisters in the Untersee Oasis. See for the location of ponds
Figure 3. Scatterplot of the relation between total pond surface area (m2) and ice blister volume (m3).
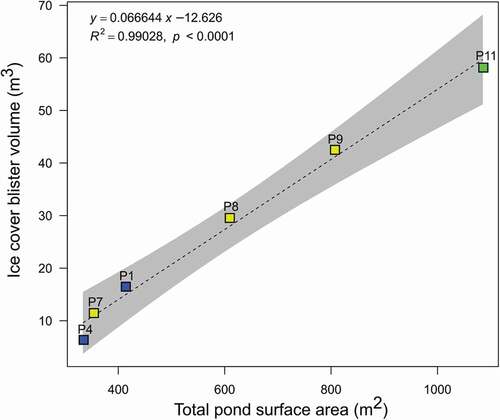
Table 2. pH, conductivity, and major ions of ponds in the Untersee Oasis. See for the location of ponds
Figure 4. Geochemical composition of ponds in the Untersee Oasis. (a) Cations ternary plot; (b) anions ternary plot; (c) concentration of major cations; and (d) Cl− normalized molar ratios line chart for Ca, Na, SO4, and TIC. Values from the oxic waters of Lake Untersee and nearby snow/firn samples have been added for comparisons (from Isaksson et al. Citation1996).
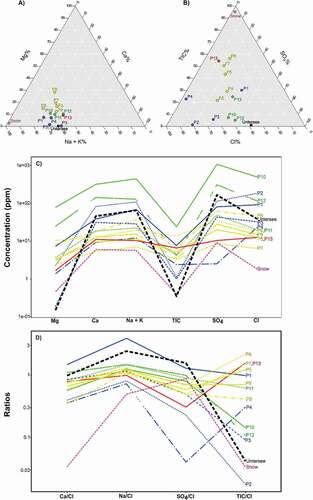
Figure 5. Scatterplots of (a) δD-δ18O of near-surface water and (b) ice cover samples of ponds in the Untersee Oasis. (c) Modeling of the evolution of δ18O and [Cl−] in the ponds under steady-state freezing (group 1) and evaporation (group 2; relative humidity set at 80 percent). In both simulations, the initial δ18O is set to −32 per mill, and the initial Cl− values are set to 5 and 10 ppm (similar to that of the nearby DML firn core; Isaksson et al. Citation1996). Also shown is steady-state freezing assuming initial δ18O = −35 per mill and 1 percent mixing rate. Grey dotted lines show the evolution of δ18O-[Cl−] for freezing only of well-sealed pond (no annual recharge). Black dots with decimal numbers indicate the fraction of residual water remaining. Squares and circles indicate ponds with and without ice cover blisters, respectively.
![Figure 5. Scatterplots of (a) δD-δ18O of near-surface water and (b) ice cover samples of ponds in the Untersee Oasis. (c) Modeling of the evolution of δ18O and [Cl−] in the ponds under steady-state freezing (group 1) and evaporation (group 2; relative humidity set at 80 percent). In both simulations, the initial δ18O is set to −32 per mill, and the initial Cl− values are set to 5 and 10 ppm (similar to that of the nearby DML firn core; Isaksson et al. Citation1996). Also shown is steady-state freezing assuming initial δ18O = −35 per mill and 1 percent mixing rate. Grey dotted lines show the evolution of δ18O-[Cl−] for freezing only of well-sealed pond (no annual recharge). Black dots with decimal numbers indicate the fraction of residual water remaining. Squares and circles indicate ponds with and without ice cover blisters, respectively.](/cms/asset/e3586a36-e326-4172-8139-3a25cfee7d65/uaar_a_2000566_f0005_oc.jpg)
Table 3. Stable water isotope (δD-δ18O) ratios, TIC, TOC, δ13CTIC, F14CTIC, and 3H composition of pond in the Untersee Oasis. See for the location of ponds
Figure 6. Scatterplots of relation between (a) TIC and δ13CTIC; (b) TOC and δ13CTOC; (c) TIC/Cl (molar ratio) and δ13CTIC, including data from MDV lakes (Neumann et al. Citation2004); and (d) δ13CTOC and δ13CTIC of ponds in the Untersee Oasis.
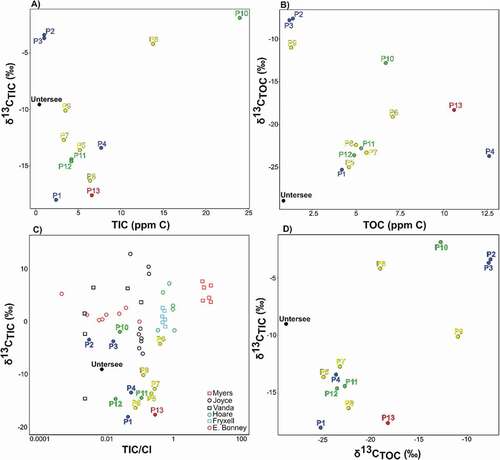
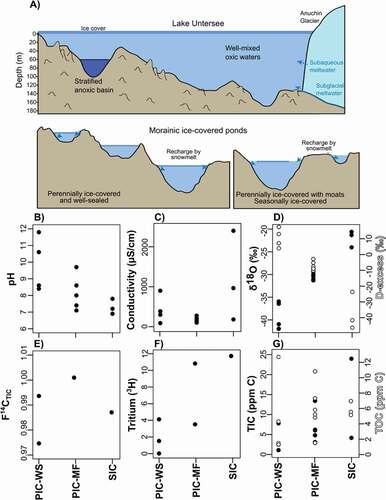
Figure 7. (a) Cross-sectional view of the perennially ice-covered Lake Untersee and the ponds in the Untersee Oasis with their differing ice cover types (i.e., from well-sealed perennial ice cover to moat-forming perennial ice cover and seasonal ice cover). Panels (b-g) indicate the pH, conductivity (uS/cm-1), δ18O, F14CTIC, Tritium (3H), and TIC (ppm C) values of near-surface waters in the ponds as a function of ice cover type. PIC-WS = perennially ice-covered and well-sealed; PIC-MF = perennially ice-covered and moat-forming; SIC = seasonally ice-covered.