Figures & data
Figure 1. Overview of the experiment site. (a) Location of Taylor Valley within the McMurdo region of Antarctica. (b) Example of ablated ice field with significant sediment accumulation on the ice surface. (c) Lake Bonney experiment site in 2016 including tripod with meteorological equipment and Scott tent containing cavity ring-down spectroscopy equipment.
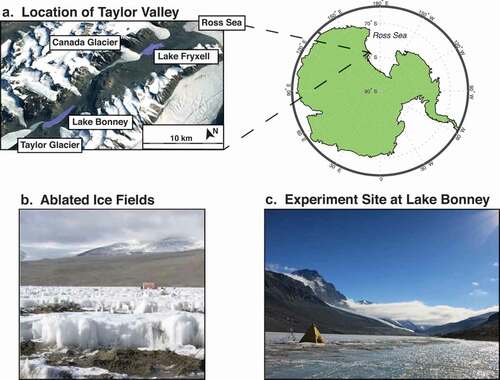
Figure 2. Cross section of a dry valley lake as it would typically appear during the austral summer, depicting mechanisms of latent heat flux and possible isotopic fractionation type.
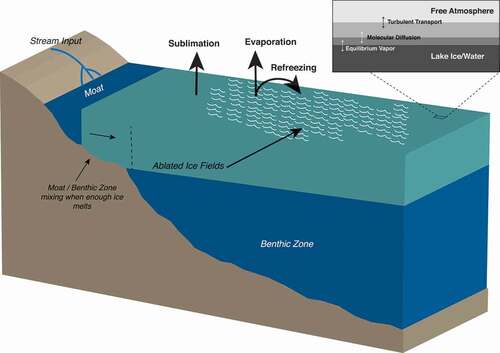
Figure 3. Meteorological data collected at both lakes. (a)–(f) Raw meteorological data (temperature, relative humidity, and wind speed) collected at Lake Bonney and Lake Fryxell during their respective field campaigns. (g)–(l) Mean hourly temperature, relative humidity, and wind speed on a typical day for both Lake Bonney and Lake Fryxell during their respective field campaigns, with standard error bars included.
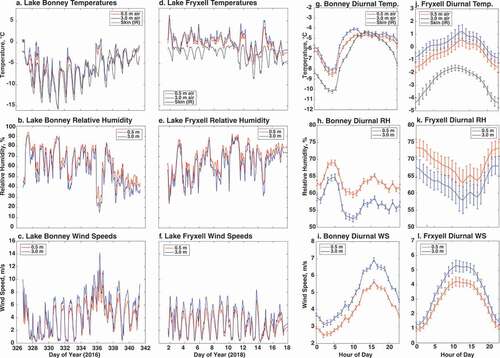
Table 1. Recent and historical isotopic measurements in Taylor Valley
Figure 4. Representations of current lake and atmospheric regression lines for (a) Lake Bonney and (b) Lake Fryxell. The Global Meteoric Water Line (GMWL) is in black, and individual atmospheric observations used to calculate the atmospheric regression lines are in gray.
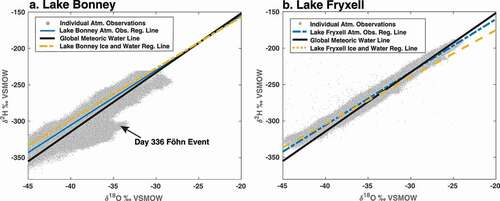
Figure 5. (a), (b) Normalized δ18O-a values at 0.5- and 3-m heights, as well as lake ice surface values, at Lake Bonney (LB) and Lake Fryxell (LF). Data presented are raw isotope data at each height normalized using equations available through Supplemental Material (S2). At Lake Bonney, there was a significant föhn wind event on day 336 and at Lake Fryxell, a small snow event on days 9 to 10. (c), (d) Red box and whisker plots showing calculated values of ε18O (εIce/Water-Vapor) of the observed δablation at Lake Bonney and Lake Fryxell, using EquationEquations (2)(2)
(2) –(Equation6
(6)
(6) ). Red lines in the εIce/Water-Vapor boxes are median values, and the top and bottom of the box represents the distribution between 75 and 25 percent of data points. For εCraig-Gordon boxes (black, offset), targets represent median values, and while the top and bottom of the box represents the distribution between 75 and 25 percent of modeled data points. (e), (f) Latent heat flux for Lake Bonney and Lake Fryxell, calculated for 100 percent sublimation and 100 percent evaporation end members, using Equations (10)–(14).
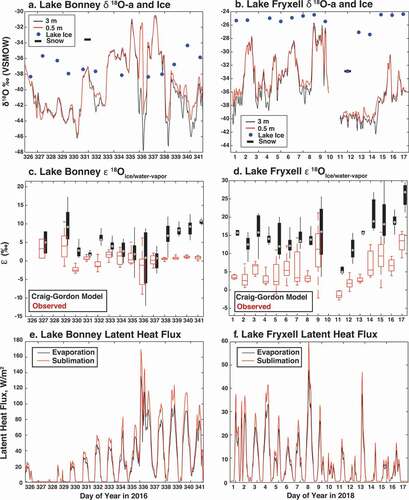
Figure 6. Analysis of boundary layer humidity (q) versus δ18O-a at Lake Bonney and Lake Fryxell for better constraining local water vapor sources. Dashed lines represent occurrence density contour lines at Lake Bonney, and solid lines represent occurrence density contour lines at Lake Fryxell. The thick blue line is the zone of predicted Rayleigh distillation, the red line represents a 100 percent ocean-based mixing model, and the yellow line represents a 100 percent land-based mixing model. Boundary layer vapor origins at both lakes suggest a primarily land-based origin.
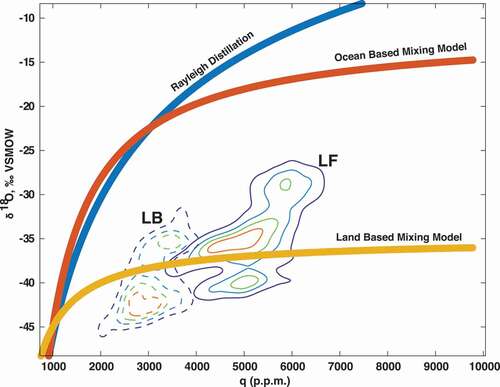
Figure 7. (a) Geographic distribution of δ18O-i in three transects at Lake Fryxell. (b) Geographic distribution of deuterium excess in three transects at Lake Fryxell.
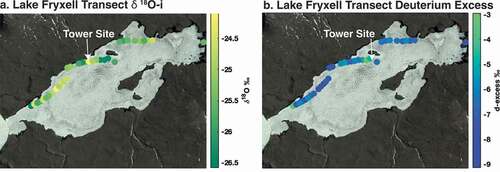
Figure 8. (a) Water vapor mass flux as a function of wind speed and relative humidity, with warmer colors expressing higher mass flux at both lakes. (b) ε18O (εIce/Water-Vapor) as a function of wind speed and relative humidity at both lakes, with warmer colors representing higher ε18O. (c) Lake Fryxell hourly average Richardson number and hourly average 3 m temperature. Lower Richardson number denotes greater instability. (d) Mean hourly epsilon and latent heat flux values at Lake Fryxell during the experimental period.
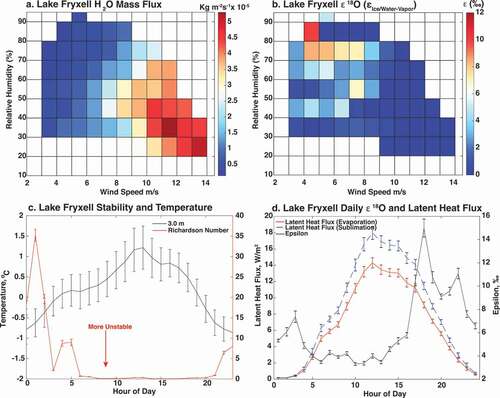
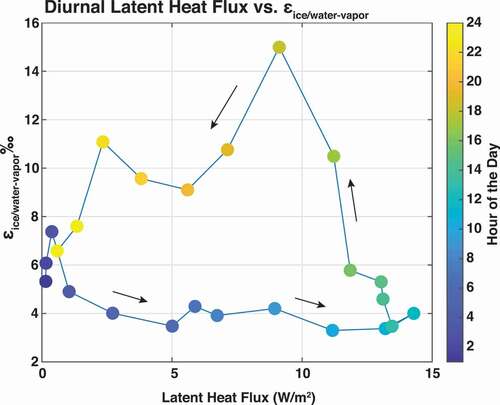
Figure 9. (a) Overview of the mean latent heat flux vs. mean ε18OIce/Water-Vapor, by hour, on a daily timescale at Lake Fryxell. During periods of increasing latent heat flux in the first part of the day, ε18OIce/Water-Vapor remains low. As latent heat flux begins to decrease later in the day, ε18OIce/Water-Vapor begins to increase. Arrows signify direction of the cycle. (b) Overview of the cycle of mean latent heat flux vs. mean ε18OIce/Water-Vapor over days 3 to 9.