Figures & data
Figure 1. A photo of the study site (2,770 m.a.s.l.). Dwarf pine Pinus pumila is distributed in the vast area near the top of Mount Norikura (summit elevation 3,026 m.a.s.l.) in central Japan.
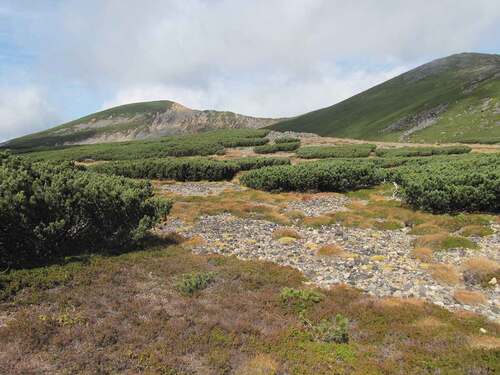
Table 1. Definitions and units of abbreviations
Figure 2. Seasonal changes in the daily maximum net photosynthetic rate and daily maximum stomatal conductance of Pinus pumila and six environmental factors at the study site in 2018. (a), (b) The black, blue, green, and red circles indicate the current and one-, two-, and three-year-old needles, respectively. The photosynthetic rate and stomatal conductance of the three-year-old needles on 10 July (DOY 191) were not plotted because of the limited measurement time in late evening between 16:00 and 18:00. The six environmental factors are (c) daily mean air temperature, (d) daily mean soil temperature at a soil depth of 5 cm, (e) daily total solar radiation, (f) daily maximum VPD, (g) daily mean volumetric SWC at a soil depth of 5 cm, and (h) daily total precipitation. Air temperature, solar radiation, precipitation, and relative humidity were obtained from the Agro-Meteorological Grid Square Data, National Agricultural Research Organization (1 × 1 km resolution). VPD was calculated from the temperature and relative humidity.
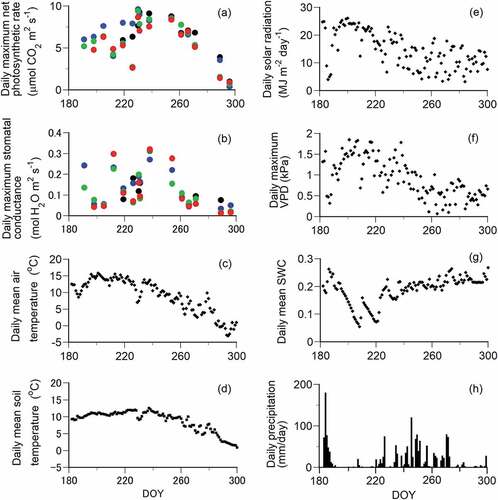
Figure 3. Examples of diurnal changes in the net photosynthetic rate (Pn) and stomatal conductance (gs) of Pinus pumila and four environmental factors on four days. The black, blue, green, and red lines indicate the current and one-, two-, and three-year-old needles, respectively. The four environmental factors are air temperature (Ta), PPFD, VPD, and volumetric SWC at a soil depth of 5 cm.
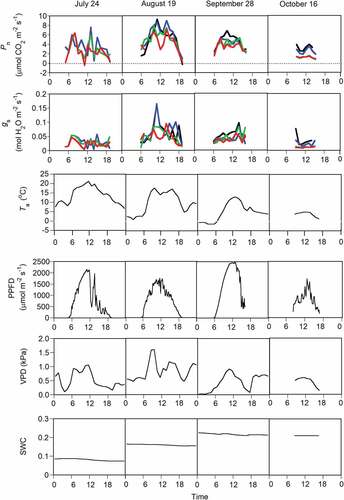
Table 2. Estimated parameters of EquationEquation (1)(1)
(1) in the main text. Parameter values of three best models are shown. AIC values of the other combinations of parameters are shown in the Appendix 1 (Table S2)
Figure 4. Relationships of net photosynthetic rates (Pn) of Pinus pumila with four environmental factors. The black, blue, green, and red circles and lines indicate the current and one-, two-, and three-year-old needles, respectively. The four environmental factors are (a) PPFD, (b) air temperature (Ta), (c) soil temperature (Ts), and (d) volumetric SWC. PPFD beside the chamber and air temperature in the chamber at the photosynthetic measurement were used for the analysis. A regression line in each panel was drawn for each needle age using EquationEquation (8)(8)
(8) on the assumption that the three other environmental factors do not limit the photosynthetic rate; that is, the equation in each panel is (a)
(b)
, (c)
, and (d)
. Each regression line indicates the change in the maximum photosynthetic rate for a certain environmental factor.
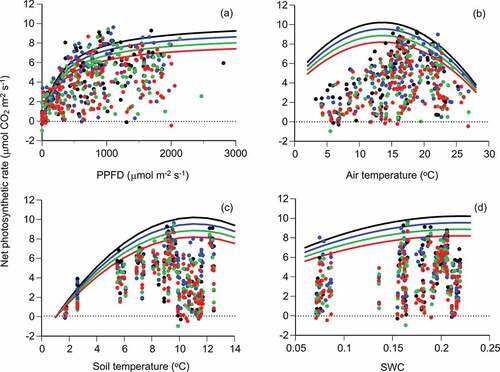
Figure 5. Comparison between observed values (dots) and expected values (lines) for the seasonal change in daily mean photosynthetic rates of Pinus pumila. The daily mean photosynthetic rate was the mean value of photosynthetic rates at hourly intervals. The panels show (a) current year needles, (b) one-year-old needles, (c) two-year-old needles, and (d) three-year-old needles.
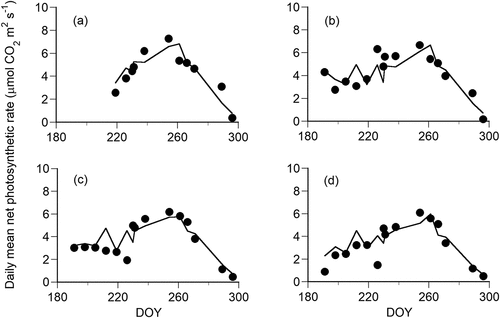
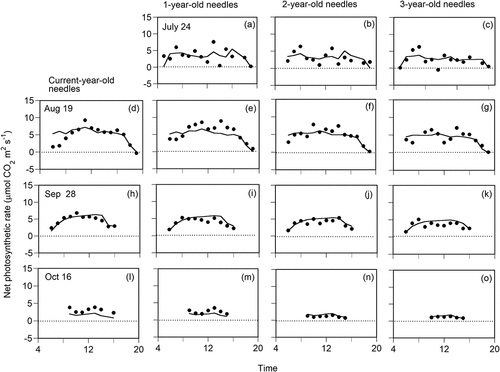
Figure 6. Examples of model fitting (lines) to observed values (dots) of net photosynthetic rates of Pinus pumila on four days in 2018: (a)–(c) 24 July, (d)–(g) 19 August, (h)–(k) 28 September, and (l)–(o) 16 October. The panels show the current and one-, two-, and three-year-old needles, respectively, from left to right.