Figures & data
Figure 1. Arapaho Glacier, taken 27 August 1960. Site map of the Arapaho Glacier in Colorado, indicated by the red X, coordinates 40°01′24″ N 105°38′53″ W, elevation 3,680 m. The distance across the snowfield is about 600 m. The D1 site is also located at the red X, being less than 1 km from the glacier, and is therefore not shown at this scale. Neighboring states of Utah (UT), Wyoming (WY), Nebraska (NE), Arizona (AZ), New Mexico (NM), Oklahoma (OK), and Kansas (KS) are indicated. Image credit: Henry Waldrop, 1960. Arapaho Glacier: From the Glacier Photograph Collection. Boulder, Colorado: National Snow and Ice Data Center. Digital media. Source: http://nsidc.org/data/glacier_photo/search/image_info/arapaho_waldrop_084.
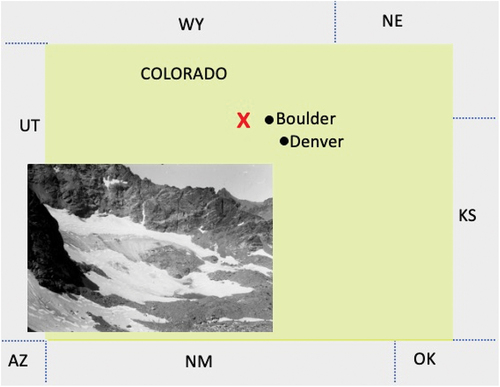
Figure 2. (a) Hourly measurements of air temperature (°C) and relative humidity (RH, %) for the Niwot Ridge data set, used to drive the Arapaho Glacier perennial snowfield model. Tair is the air temperature. (b) Wind speed and precipitation rate.
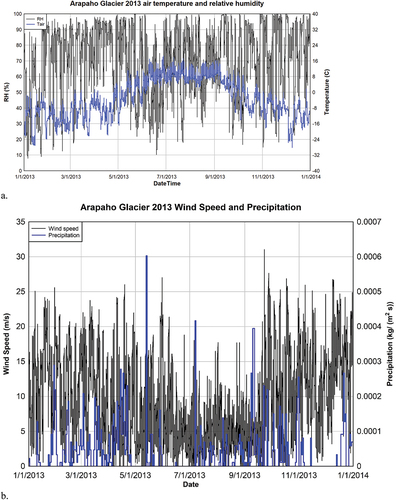
Figure 3. Site map of the perennial snowfields in Mongolia, coordinates 51°10′45″ N 98°58′06″ E, elevation 2,243 m. The red X marks the general location of the snowfields from Taylor et al. (Citation2019). Insert A shows a snowfield that appears to be a river icing and a smaller snowfield (B) that appears to be on the shore of the stream. These snowfields are close to, perhaps identical to, Site 3 from Taylor et al. (Citation2019). North is upward in the insert. Digital Globe Image was taken on 15 July 2015 and provided to the National Aeronautics and Space Admininstration with no restrictions on use or copying.
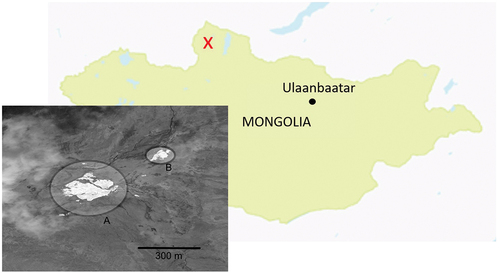
Figure 4. (a) Hourly measurements of air temperature (°C) and relative humidity (%) used to drive the Ulaan Taiga perennial snowfield model. Tair is the air temperature. (b) Wind speed and precipitation rate.
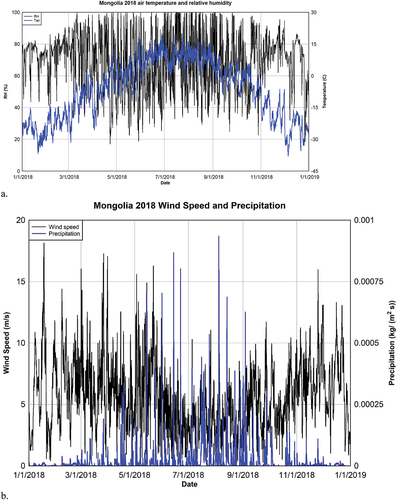
Table 1. Base case model parameters for Ulaan Taiga, Mongolia, and Arapaho Glacier, Colorado. These parameters are later varied in order to determine model sensitivities.
Figure 5. Sensitivity of the snow column mass balance to experiments for the Arapaho Glacier case where the initial modeled snow depth is 4.5 m. “C. Warming” and “N. Warming” refer to constant warming and nighttime warming scenarios, respectively.
Figure 6. Sensitivity of the snow column mass balance to experiments for the Ulaan Taiga, Mongolia, case where the initial modeled snow depth is 4.5 m. “C. Warming” and “N. Warming” refer to constant warming and nighttime warming scenarios, respectively.
Figure 7. Change in modeled snowpack lifetime for the 1.0-m Arapaho Glacier cases. The base case lifetime for 1-m snowpack was 247 days. As explained in the text, the wind case survived for an entire year and is therefore plotted as 48 percent longer than the base case lifetime. “C. Warming” and “N. Warming” refer to constant warming and nighttime warming scenarios, respectively.
Figure 8. Change in modeled snowpack lifetime for the 1.0-m cases for Ulaan Taiga, Mongolia, experiments. The base case lifetime for a 1-m snowpack was 221 days. “C. Warming” and “N. Warming” refer to constant warming and nighttime warming scenarios, respectively.
Figure 9. Model sensitivity test analysis for the Arapaho Glacier 4.5-m case. Note change of scale relative to to 8.
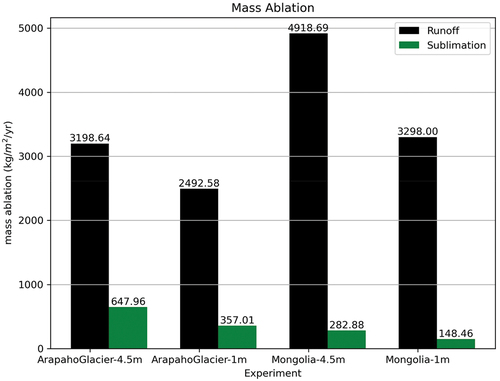
Figure 10. Total snowpack ablation amounts due to sublimation and melting for both snowfields in both locations. The amounts are shown for the base case. The Arapaho Glacier and Mongolia experiments were conducted with a 4.5-m snowpack.