Figures & data
Figure 1. Location map of the study region in QTP and overview of the Pamir.
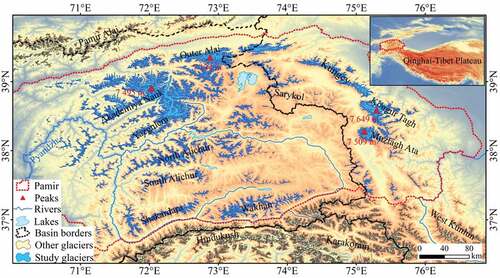
Figure 2. Manual delineation of clear glacier outlines: (a) false-color composite landsat image (bands 7, 2, 3 as RGB) and (b) Google Earth image.
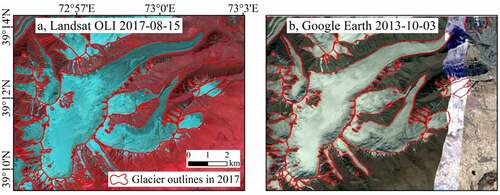
Figure 3. Manual delineation of debris-covered glacier outlines: (a) false-color composite Landsat image (bands 7, 2, 3 as RGB); (b) Google Earth image; (c) and (d) close-ups of the Malyy Tanymas Glacier tongue in Landsat and Google Earth images, respectively; (e) and (f) close-ups of another debris-covered glacier tongue in Landsat and Google Earth images, respectively.
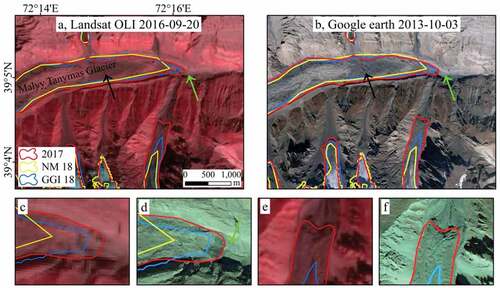
Table 1. Comparison with other glacier inventories of the Pamir
Figure 4. Examples of glacier outline delineation in 2000 and 2017: (a) and (b) glacier outlines in 2000 and 2017 for the same clear glaciers, respectively; (c) and (d) glacier outlines in 2000 and 2017 for a debris-covered glacier and a surging glacier, respectively.
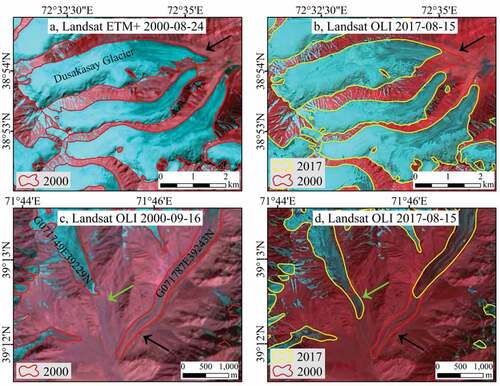
Figure 5. Map of glacier area change (a) and change rate (b) on a 0.25°×0.25° grid of the Pamir from 2000 to 2017.
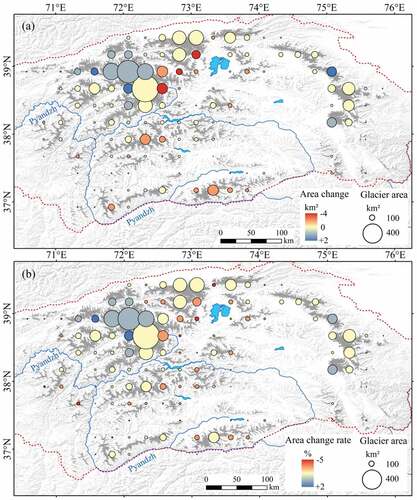
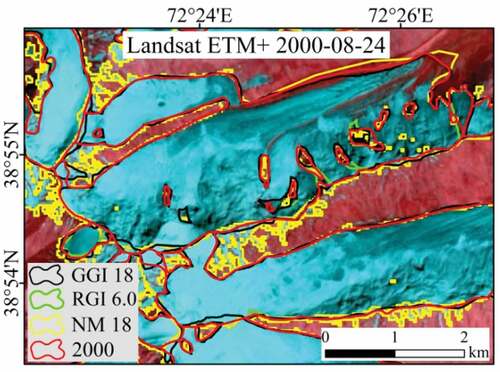
Figure 6. Comparison of glacier outlines used in the NM 18, GGI 18, RGI 6.0, and our 2000 inventory at 38.90° N, 72.45° E (false-color composite image, bands 7, 2, 3 as RGB for ETM+).