10,290
Views
2
CrossRef citations to date
0
Altmetric
Research Article

Hindcasts of passerine density in arctic and subarctic Alaska suggest noncomplementary responses to shrub expansion by tundra- and shrub-adapted species

ORCID Icon & ORCID Icon
Pages 25-39 | Received 19 Apr 2021, Accepted 17 Jan 2022, Published online: 28 Feb 2022

Figures & data

Figure 1. (a) Location of passerine monitoring sites in three national parks in Alaska including arctic-west (AW) and arctic-central (AC) in Noatak National Preserve, arctic-east (AE) in Gates of the Arctic National Park and Preserve, and subarctic (SU) in Denali National Park and Preserve. (b) An example of our route, plot, and grid configuration from the arctic-central site.
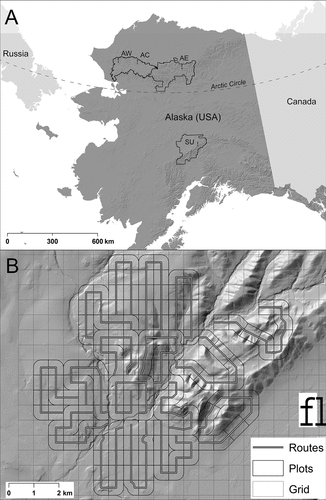
Figure 1. (a) Location of passerine monitoring sites in three national parks in Alaska including arctic-west (AW) and arctic-central (AC) in Noatak National Preserve, arctic-east (AE) in Gates of the Arctic National Park and Preserve, and subarctic (SU) in Denali National Park and Preserve. (b) An example of our route, plot, and grid configuration from the arctic-central site.

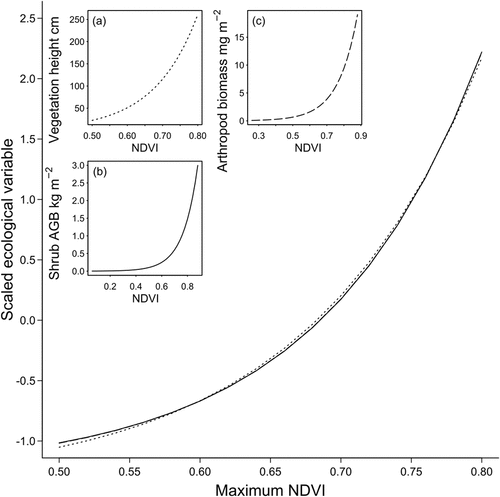
Figure 2. Exponential relationships between maximum NDVI and ecological variables in arctic tundra. In the main plot, the relationships are shown for the same range of NDVI values (0.5–0.8) with the response (the ecological variable) standardized to have mean 0 and SD = 1. The insets show these relationships on their real scale within the range of NDVI values evaluated in each study and with line types corresponding to those shown in the main plot, although they overlap considerably. The three insets include (a) binnedvegetationheight=0.38×exp8.1635NDVI (Bartsch et al. Citation2020), (b) shrubabovegroundbiomassAGB=0.0012×exp8.89NDVI (Berner et al. Citation2018), and (c) arthropodbiomass=0.008×exp8.835NDVI (Sweet et al. Citation2015).

Figure 2. Exponential relationships between maximum NDVI and ecological variables in arctic tundra. In the main plot, the relationships are shown for the same range of NDVI values (0.5–0.8) with the response (the ecological variable) standardized to have mean 0 and SD = 1. The insets show these relationships on their real scale within the range of NDVI values evaluated in each study and with line types corresponding to those shown in the main plot, although they overlap considerably. The three insets include (a) binnedvegetationheight=0.38×exp8.1635∗NDVI (Bartsch et al. Citation2020), (b) shrub aboveground biomass AGB=0.0012×exp8.89∗NDVI (Berner et al. Citation2018), and (c) arthropod biomass=0.008×exp8.835∗NDVI (Sweet et al. Citation2015).

Figure 3. Change in annual maximum NDVI between 1999 and the survey year in the (a) arctic-west, (b) arctic-central, (c), arctic-east, and (d) subarctic study areas.
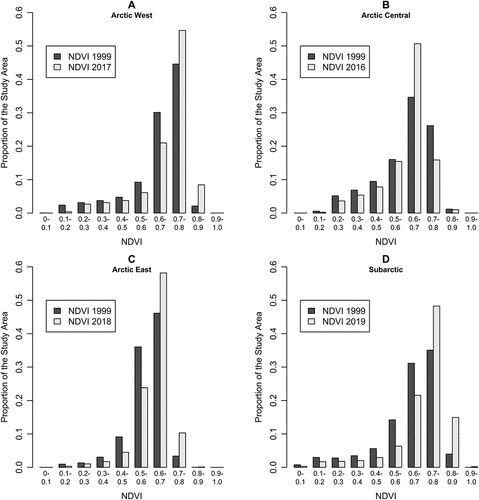
Figure 3. Change in annual maximum NDVI between 1999 and the survey year in the (a) arctic-west, (b) arctic-central, (c), arctic-east, and (d) subarctic study areas.

Figure 4. Density–NDVI relationships at the arctic-central site for (a) tundra and low shrub–adapted passerines and (b) tall shrub–adapted passerines. Curves represent the expected change in density per unit change of maximum NDVI, while holding the intercept and all other covariates at 0; that is, they are predictions of the exponentiated coefficients for linear and quadratic NDVI. The intercept has been removed to allow plotting the effects from all species on the same scale. Though the arctic-central site was used for display purposes, the shape of these relationships was similar across sites. Species codes in (a): American pipit (AMPI), Lapland longspur (LALO), and Savannah sparrow (SAVS). Species codes in (b): white-crowned sparrow (WCSP), American robin (AMRO), American tree sparrow (ATSP), golden-crowned sparrow (GCSP), Wilson’s warbler (WIWA), and fox sparrow (FOSP).
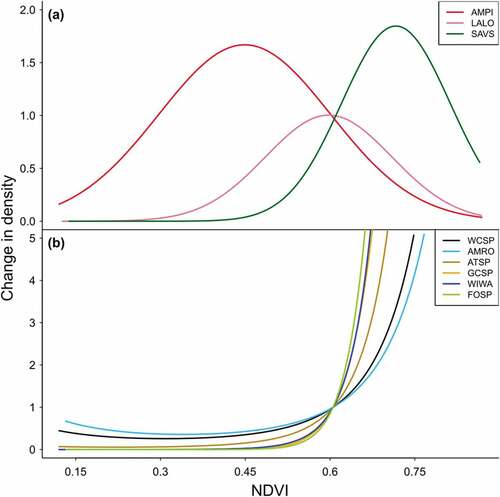
Figure 4. Density–NDVI relationships at the arctic-central site for (a) tundra and low shrub–adapted passerines and (b) tall shrub–adapted passerines. Curves represent the expected change in density per unit change of maximum NDVI, while holding the intercept and all other covariates at 0; that is, they are predictions of the exponentiated coefficients for linear and quadratic NDVI. The intercept has been removed to allow plotting the effects from all species on the same scale. Though the arctic-central site was used for display purposes, the shape of these relationships was similar across sites. Species codes in (a): American pipit (AMPI), Lapland longspur (LALO), and Savannah sparrow (SAVS). Species codes in (b): white-crowned sparrow (WCSP), American robin (AMRO), American tree sparrow (ATSP), golden-crowned sparrow (GCSP), Wilson’s warbler (WIWA), and fox sparrow (FOSP).

Figure 5. Relative change in density from 1999 to the survey year for passerine species at four sites in Alaska including (a) arctic-west (1999–2017), (b) arctic-central (1999–2016), (c) arctic-east (1999–2018), and (d) subarctic (1999–2019). Species are numbered according to the strength of their association with increasing NDVI; that is, they are ordered according to the average NDVI value (across sites) at which 50 percent of their total expected abundance was reached. Species included (1) American pipit, (2) Lapland longspur, (3) Savannah sparrow, (4) white-crowned sparrow, (5) American robin, (6), American tree sparrow, (7) golden-crowned sparrow, (8) orange-crowned warbler, (9) Wilson’s warbler, and (10) fox sparrow. Missing estimates for some species–study site combinations indicate that the species was absent from the site or had an intercept-only model. Posterior means and 95 percent highest posterior density credible intervals are shown in relation to a horizontal line at 1, which indicates no change.
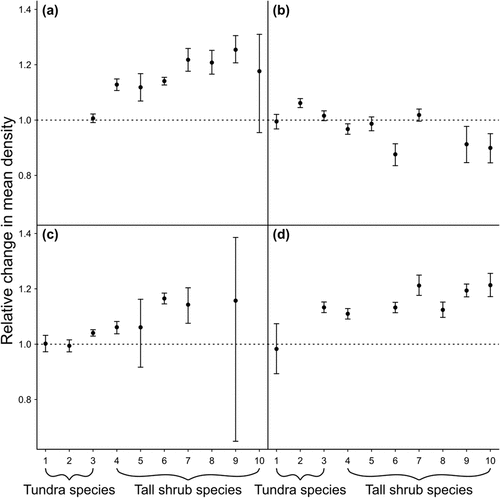
Figure 5. Relative change in density from 1999 to the survey year for passerine species at four sites in Alaska including (a) arctic-west (1999–2017), (b) arctic-central (1999–2016), (c) arctic-east (1999–2018), and (d) subarctic (1999–2019). Species are numbered according to the strength of their association with increasing NDVI; that is, they are ordered according to the average NDVI value (across sites) at which 50 percent of their total expected abundance was reached. Species included (1) American pipit, (2) Lapland longspur, (3) Savannah sparrow, (4) white-crowned sparrow, (5) American robin, (6), American tree sparrow, (7) golden-crowned sparrow, (8) orange-crowned warbler, (9) Wilson’s warbler, and (10) fox sparrow. Missing estimates for some species–study site combinations indicate that the species was absent from the site or had an intercept-only model. Posterior means and 95 percent highest posterior density credible intervals are shown in relation to a horizontal line at 1, which indicates no change.

Figure 6. Difference in point intensity (number of males/30-m pixel) for American tree sparrow between 1999 and the survey year within a 300-m sampling strip at four sites in Alaska: (a) arctic-west (1999–2017), (b) arctic-central (1999–2016), (c) arctic-east (1999–2018), and (d) subarctic (1999–2019).
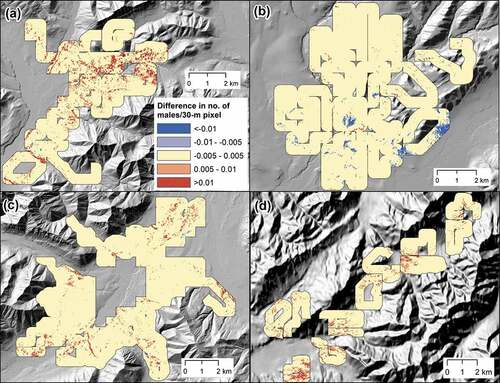
Figure 6. Difference in point intensity (number of males/30-m pixel) for American tree sparrow between 1999 and the survey year within a 300-m sampling strip at four sites in Alaska: (a) arctic-west (1999–2017), (b) arctic-central (1999–2016), (c) arctic-east (1999–2018), and (d) subarctic (1999–2019).

Figure 7. Difference in point intensity (number of males/30-m pixel) for Savannah sparrow between 1999 and the survey year within a 300-m sampling strip at two sites in Arctic Alaska: (a) arctic-west (1999–2017) and (b) arctic-central (1999–2016).
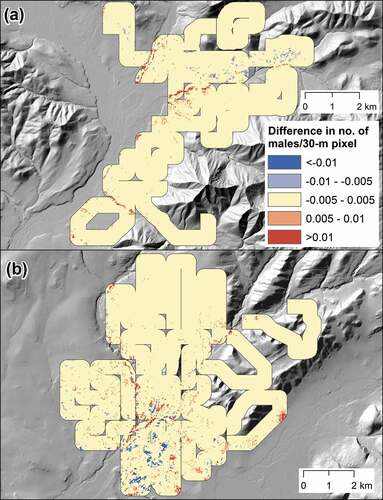
Figure 7. Difference in point intensity (number of males/30-m pixel) for Savannah sparrow between 1999 and the survey year within a 300-m sampling strip at two sites in Arctic Alaska: (a) arctic-west (1999–2017) and (b) arctic-central (1999–2016).
Supplemental material

Supplemental Material

Download Zip (2.9 MB)