
Figures & data
Figure 1. Historical sea level data through 2020 and estimated future sea level rise (with 'likely' confidence ranges). Projections and ranges are shown for the IPCC AR6 SSP1-2.6 (blue) and SSP3-7.0 (red) scenarios, with additional story-lines.Citation3
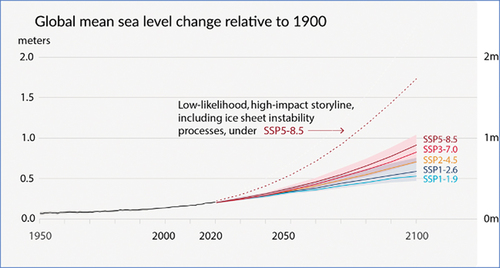
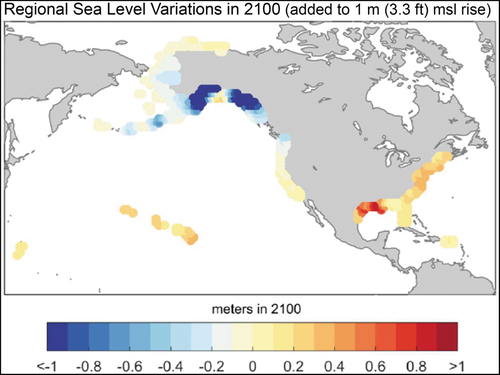
Figure 2. Projected regional sea level change for 2100 (in meters from year 2000 levels) for U.S. coasts relative to a mean rise everywhere of 1 m (figure 13 in Sweet et al.Citation5).
Supplemental material