
Figures & data
Figure 1. (a) Study region in northern Patagonia (black rectangle); map downloaded from (Earth Explorer Citation2000) https://earthexplorer.usgs.gov/. (b) Location of the Craig Goch and Lago Vintter study areas (black circles), weather stations (black stars), and additional places of interest (ER = Esquel Range; NPR = Nahuel Pan Range; CS = Cerro Situaciòn); background downloaded from (Japan Aerospace Exploration Agency Citation2021) https://www.eorc.jaxa.jp/ALOS/en/aw3d30. (c) Simplified Walter and Lieth (Citation1967) climate diagrams (R software, “climatol” package; Guijarro Citation2019) for Esquel Airport and Alto Palena; meteorological data from https://sv.climate-data.org/.
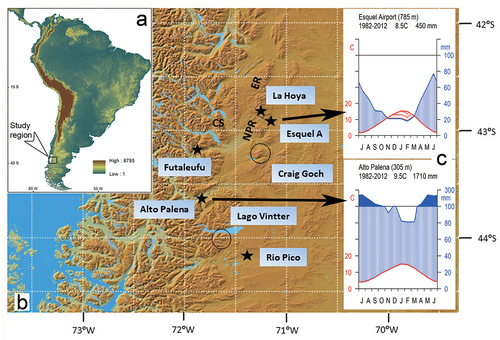
Table 1. Location and climate normals of weather stations in the region of interest.
Figure 2. (a) Map of the Craig Goch study area showing topography (peaks and contour lines), large-scale landform features (cirques, moraine ridges, rock glaciers, nivation hollows), land cover (true color image background), and location of transects and sampled profiles. The legend unit “Glaciers” only applies to the Lago Vintter study area (see Figure 2b). (b) Map of the Lago Vintter study area showing topography (peaks and contour lines), large-scale landform features (glaciers, cirques, moraine ridges, rock glaciers, nivation hollows), land cover (true color image background), and location of transects and sampled profiles. The mountaintop (1,822 m) near site VT T1-1 is locally known as “Peak Gretel.” Site CF stands for Cors Fochno (Fochno Bog), a large peatland area located at 1,010 m elevation, characterized by a 233-cm peat deposit underlain by 210-cm (glacio-) fluvial and lacustrine deposits. For legend, see Figure 2a.
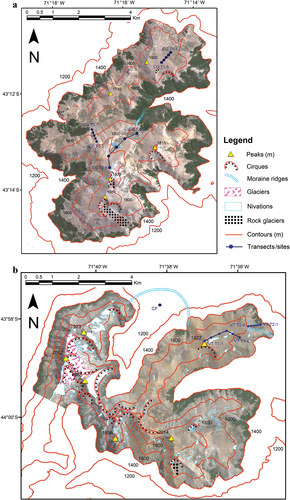
Figure 3. (a)–(f) Examples of land cover classes and landform types in Craig Goch: (a) bare ground on frost-shattered bedrock and a small rock glacier (c. 1,800–1,900 m); (b) sparse alpine vegetation on large stripes, site CG T3-5 (c. 1,700 m); (c) sparse alpine vegetation in area with small solifluction lobes, site CG T1-4 (c. 1,690 m); (d) dense alpine vegetation on outwash plain with terminal moraine in the background, site CG T2-3 (c. 1,750 m); (e) dense alpine vegetation on stabilized solifluction slope with bare area, site CG T1-1 (c. 1,625 m); (f) patch of Nothofagus forest, site CG T3-1, patchy and sparse alpine vegetation, sites CG T3-2 to T3-4, on colluvium slope (c. 1,500–1,650 m).

Figure 3. Continued. (g)–(l) Examples of land cover classes and landform types in Lago Vintter: (g) glaciers and steep bedrock (c.1,700–2,000 m); (h) bare ground on small stripes, site VT T1-2 (c. 1,750 m); (i) bare ground and nivation hollow, site VT T2-6 (c. 1,550 m);(j) dense alpine vegetation with bare area on solifluction terrace, near site VT T2-5 (c. 1,515 m); (k) dense alpine vegetation on stabilized solifluction slope, site VT T1-6 (c. 1,550 m); (l) patch of Nothofagus forest on colluvium, site VT T2-1, with alpine vegetation and nivation hollow in the background, sites VT T2-2 to T2-6, and lateral moraine to the right (c. 1,400–1,550 m).
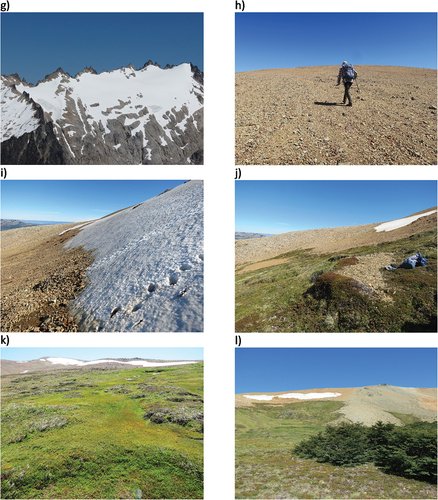
Table 2. Radiocarbon dates of selected soil samples reported as 14C ages and calibrated ages.
Figure 4. (a) Geochemical properties of selected soil profiles from the Craig Goch study area indicating land cover class, landform type, altitude, and total SOC storage. Depths of dated horizons are indicated with black crosses in the %C and C/N panel to the right.
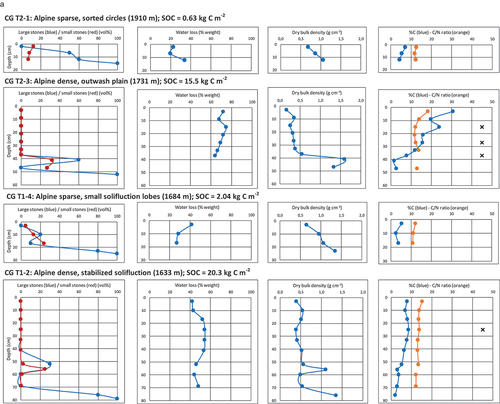
Figure 4. Continued. (b) Geochemical properties of selected soil profiles from the Lago Vintter study area indicating land cover class, landform type, altitude,and total SOC storage. Depths of dated horizons are indicated with black crosses in the %C and C/N panel to the right.
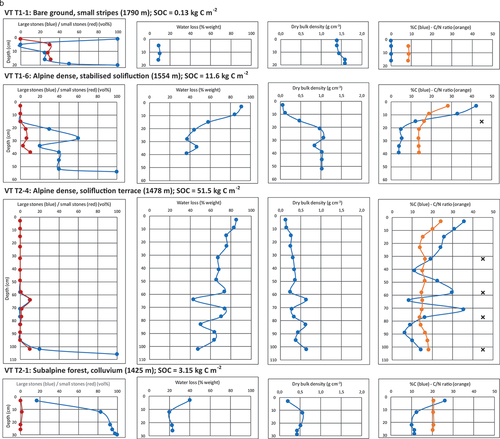
Table 3. Attributes and SOC storage (kg C m−2) for each land cover class (mean and standard deviation) and weighed SOC storage (kg C m−2) considering proportional representation of land cover classes for Craig Goch and Lago Vintter combined total study area and for alpine vegetated area only (mean and confidence interval).
Figure 5. Proportional contribution to area (blue) and SOC 0–100 cm storage (orange) of each land cover class in the (a) Craig Goch and (b) Lago Vintter study areas.
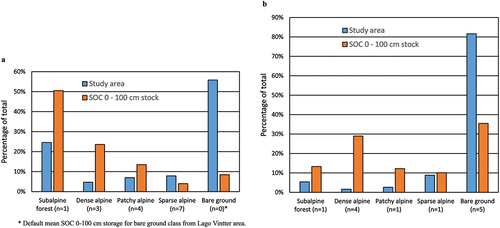
Table 4. Attributes and mean and standard deviation of total SOC storage (kg C m−2) for the full depth of soil profiles for different landform types in the Craig Goch and Lago Vintter combined study area.
Figure 6. Schematic representation of glacial and periglacial landforms in Craig Goch (a) and Lago Vintter (d) and comparison of plant cover (b) and SOC storage (c) between study areas as a function of elevation.
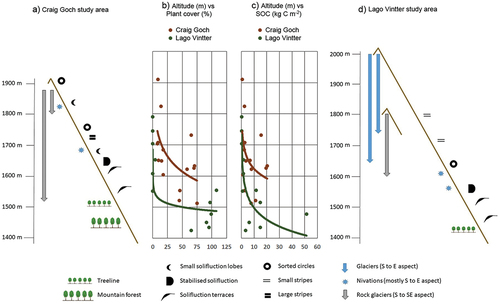
Figure A1. Third-order polynomial fit between LOI at 550°C (% weight) and %C in the elemental analysis (% weight) values for eighty-nine soil samples. Three outliers at very low %C (overlapping red dots) are excluded from the regression.
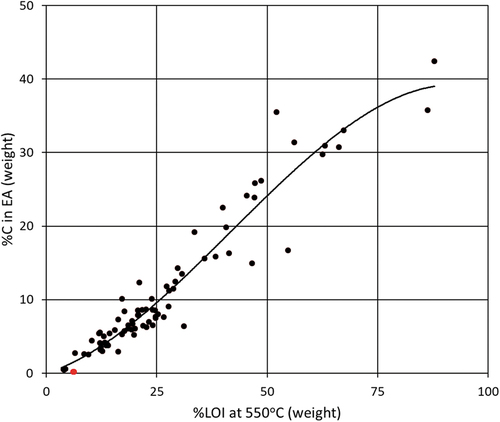
Figure A2. Correlations of (a) SOC 0–30 cm and 0–100 cm storage with plant cover for all profile sites (exponential fits), (b) total SOC storage with full soil depth for all profile sites (second-order polynomial fit), (c) C content with soil moisture for all soil samples (second-order polynomial fit), and (d) C density with soil moisture for all soil samples (second-order polynomial fit). All regressions are significant (p < .05).
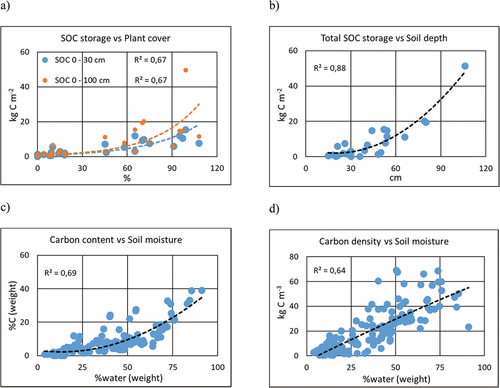
Table A1. Transect and soil profile summary with geographic coordinates, topography (altitude and slope), land cover class, landform type, soil profile depth, surface cover of bare mineral ground including large stones, and total SOC storage.
Table A1. Continued. Transect and soil profile summary with total plant cover, mean height of upper vegetation stratum, coverage of plant functional types, litter, water and surface mineral bare ground (grain size <4 cm) and large stones (≥4 cm).