
Figures & data
Figure 1. Location of the study lakes.
Table 1. Select parameters of the study lakes
Figure 2. Temperature profile (colored contours) and Z1percentPAR depth (solid pink line) on left-hand panels and vertical profile of the distribution of Aulacoseira pusilla on right-hand panels between 11 to 28 July 2017 in (A), (B) Kersey Lake, (C), (D) Beartooth Lake, and (E), (F) Beauty Lake.
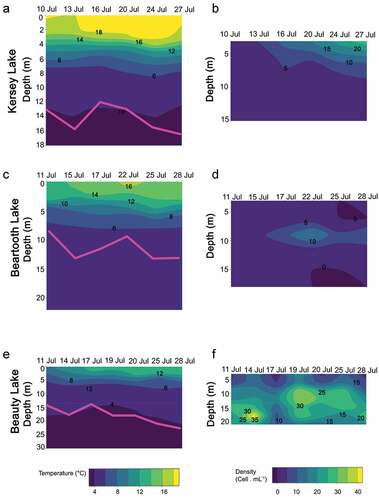
Figure 3. Nutrient concentrations and ratios in Kersey, Beauty, and Beartooth lakes during the study. DIN:TP ratio calculated using concentrations in micrograms per liter. Geometric shapes indicate the type of nutrient limitation in each lake strata. Colors of geometric shapes identify the lake strata. Circles indicate N limitation, squares indicate P limitation, and triangles indicate N + P limitation.
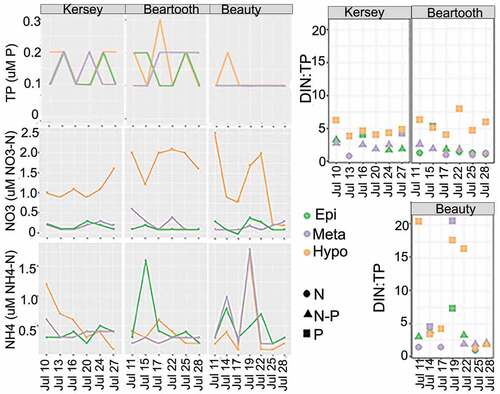
Figure 4. Phytoplankton composition in Kersey, Beauty, and Beartooth lakes. (A) Percentage of the total cell density. Vertical distributions over time of the main phytoplankton taxa found in (B) Kersey Lake, (C) Beartooth Lake, and (D) Beauty Lake. Empty spaces in (D) correspond to the depths where the algae were not observed.
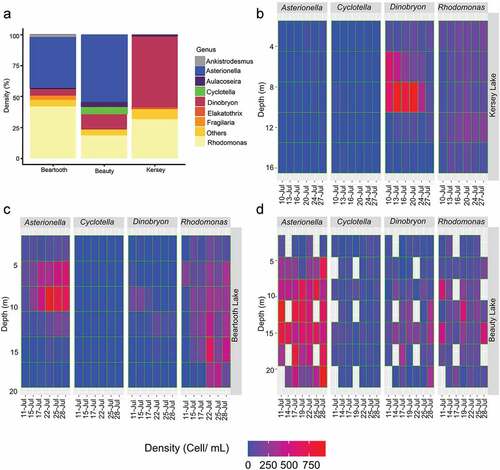
Table 2. Average values of physical and chemical parameters in Kersey and Beauty Lake water samples used in the experiments
Table 3. Average temperature and irradiance in Beauty Lake for experiments incubated at different depths
Figure 5. Response of Aulacoseira pusilla to incubation depth (epilimnion, metalimnion, hypolimnion) and nutrients (control, N + P) in bioassay experiments: (A) cell density and (B) growth rate in Kersey Lake populations; (C) cell density and (D) growth rate in Beauty Lake populations. Box ends are 25th and 75th percentiles; bold bars within boxes are 50th percentiles. Letters inside plots denote the results of post hoc analyses. Treatments with different letters indicate a significant difference between those treatments.
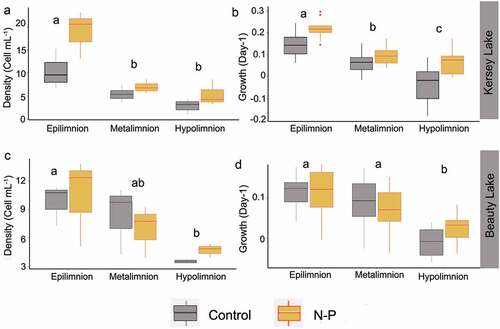
Figure 6. The response of Aulacoseira pusilla from Kersey Lake populations to different levels of light expressed as a percentage of ambient (100 percent, 60 percent, or 25 percent) at 2-m depth: (A) density and (B) growth rate. Box ends are 25th and 75th percentiles; bold bars within boxes are 50th percentiles.
Table 4. Values of the results of ANOVA analyses for the Nutrients addition x incubation depths, and light access experiments for Kersey Lake and Beauty Lake populations