Figures & data
Figure 1. Distribution of surface duct (a) occurrence, (b) strength, and (c) depth during winter months of December 2017 to February 2020. The cyan, red, and blue bars are statistics for ducts in December, January, and February, respectively.
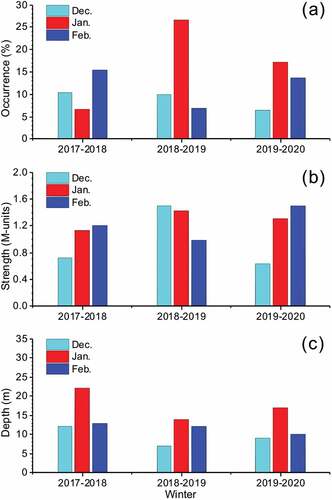
Table 1. T-type and H-type surface ducts in Svalbard winter, with strength in monitor units.
Figure 2. Percentage contributions of temperature and humidity terms to surface ducts at Svalbard in winter months from December 2017 to February 2020. The duct cases are denoted by solid circles, with sizes for relative strength and color grades for strength. The dashed line denotes the division of 50 percent contributions by temperature and humidity terms.
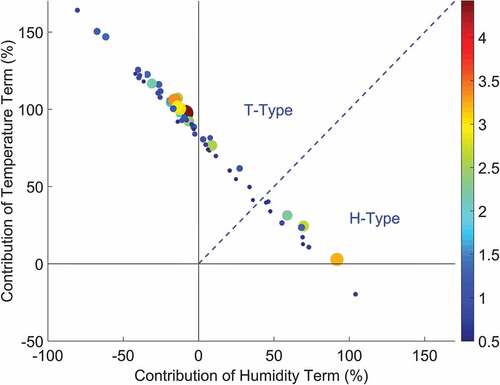
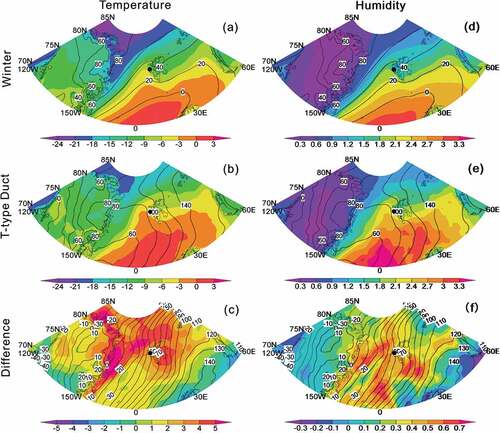
Figure 3. Atmospheric situations at 1,000 hPa for winter average, T-type duct days, and their difference from December 2018 to February 2020. The plotted area is at latitudes from 70° N to 85° N and longitudes from 120° W to 600° E, with Ny-Ålesund, Svalbard, denoted by a black dot. The contours are geopotential height (m). The color grades are (a)–(c) air temperature (°C) and (d)–(f) air humidity (g/kg). (a), (d) Winter average, (b), (e) T-type duct days, and (c), (f) difference of T-type duct days from winter average.
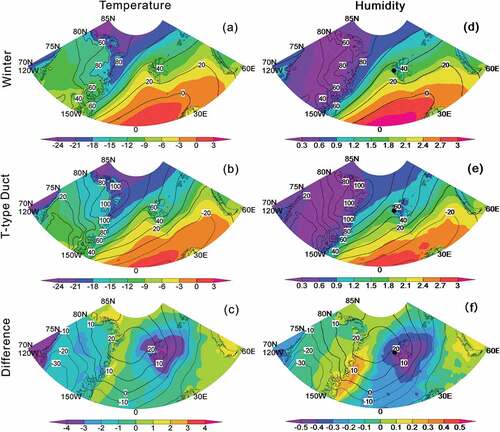
Figure 4. Atmospheric situations on 1,000 hPa for winter average, H-type duct days, and their difference from December 2018 to February 2020. The plotted area is at latitudes from 70° N to 85° N and longitudes from 120° W to 60° E, with Ny-Ålesund, Svalbard, denoted by a black dot. The contours are geopotential height (m). The color grades are (a)–(c) air temperature (°C) and (d)–(f) air humidity (g/kg). (a), (d) Winter average, (b), (e) H-type duct days, and (c), (f) difference of H-type duct days from winter average.