Figures & data
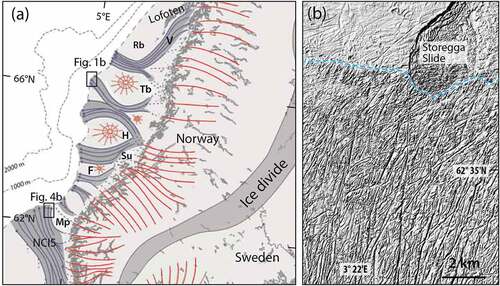
Figure 1. (a) Overview map of the mid-Norwegian shelf and continental slope. NC – Norwegian Channel, Mp – Måløy Plateau, Bu – Buagrunnen, Fb – Frøyabanken, Ha – Haltenbanken, Sk – Sklinnabanken, Tb – Trænabanken, Td – Trænadjupet, Rø – Røstbanken, Ve – Vestfjorden. (b) Overview map of the continental shelf and slope areas north of Skjoldryggen in the northern part of the mid-Norwegian shelf (located in a). Blue stippled line is the shelf edge. Red lines show the mapped tidal influenced iceberg ploughmarks each marked with a black number (). (c) Overview map of the North Atlantic with the modern ocean-surface circulation (Sætre Citation2007). NAC is Norwegian Atlantic Current. NCC is Norwegian Coastal Current. Bathymetric data: ©Kartverket.
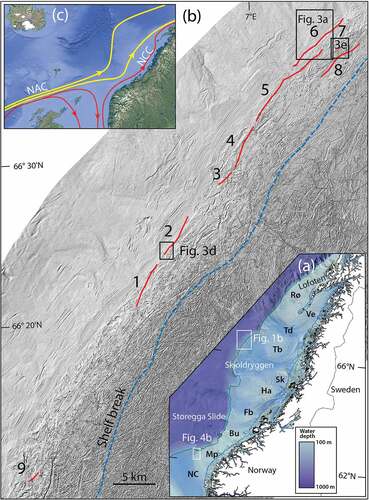
Figure 2. Three types of tidally influenced iceberg ploughmarks (IPMs) on the mid-Norwegian upper slope shown in plan-view multibeam images and as depth profiles. (a) Continuous iceberg ploughmark with regularly spaced depressions along the center line of the ploughmark. (b) Seafloor depth profile along the center line of the ploughmark shown in a. (c) Chain of asymmetrical pits. (d) Seafloor depth profile along the chain of asymmetrical pits shown in c. (e) Chain of circular pits. (f) Seafloor depth profile along the chain of circular pits shown in e. The y-axes of panels b, d and f is water depth. Bathymetric data: ©Kartverket.
Table 1. Dimensions of iceberg ploughmarks (IPMs; located in ) and associated pits
Figure 3. Examples of multibeam bathymetry (shaded relief images) of the seafloor on the upper mid-Norwegian slope showing tidally influenced iceberg ploughmarks (located in ). (a) IPM 6. The image shows a 4 km-long ploughmark with continuous elements and asymmetrical pits. Inset shows depth profile along the center-line of the ploughmark. (b) Detail of IPM6 showing a quasi-continuous depression with berms or surcharges in front of individual pits in plan and profile. (c) Detail of IPM6 showing individual asymmetrical to circular ploughmarks separated by a smooth seafloor in plan and profile. (d) IPM 2. The image shows a continuous ploughmark with regularly spaced pits along its center-line. Inset shows depth profiles along the axis of the ploughmark (black line) and 50 m offset profile of the unplowed seafloor (stippled line). (e) IPM 7. The image shows continuous and asymmetrical ploughmarks. Inset shows depth profile along the center-line of the ploughmark (black line) and 50 m offset profile of the unplowed seafloor (stippled line). In each panel the x-axis is distance and the y-axis is water depth. Bathymetric data: ©Kartverket.
Figure 4. (a) Map of the late Weichselian ice streams draining the Scandinavian Ice Sheet at the LGM (from Ottesen, Dowdeswell, and Rise Citation2005). Purple lines with arrowheads are ice streams in cross-shelf troughs, red circular symbols are slower-moving ice on shallow banks, and red lines represent flow-directions from the ice-sheet interior. NCIS – Norwegian Channel Ice Stream, Mp – Måløy Plateau, F – Frøyabanken, H – Haltenbanken, Su – Suladjupet, Tb – Trænabanken, Rb – Røstbanken, V–Vestfjorden. (b) Multibeam bathymetric image of iceberg ploughmarks in the outer part of the Norwegian Channel (). Note the dominant S-N trend of the ploughmarks. The shelf edge (stippled blue line) is at a water depth of about 440 m. Bathymetric data: ©Kartverket.