Figures & data
Figure 1. Site locations of the Mackenzie Valley Permanent Monitoring Plot Network with respect to permafrost zones (Heginbottom, Dubreuil, and Parker Citation1995) and level II ecoregions (Ecosystem Classification Group Citation2007, Citation2008, Citation2010) in the Northwest Territories, Canada.
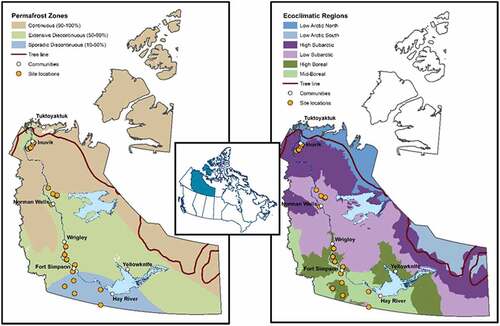
Figure 2. Sample site layout encompassing upland forest, peat plateau, and collapse scar environments along a topographic gradient. Soils and active layer depths vary along this gradient, with a transition from mineral (white) soils in the upland to organic (gray) soils in the peat plateau and collapse scar. The shallowest active layer depths are found in the peat plateaux, with permafrost (hatched) absent from collapse scars and may or may not be present at depth in upland forests. Figure has been adapted from Errington, Bhatti, and Li (Citation2018).
Figure 3. Plot-level layout and sampling design, showing the eight 1 × 1 m vegetation quadrats within the larger 20 × 20 m permanent monitoring plot (PMP) and the four 0.25 × 0.25 m clip plots located outside the PMP boundaries. Quadrats were located in PMP corners and at the midpoints between the corners and the plot center (PC). Clip plots were located according to a stratified random design with respect to four classes of total lichen cover (<25 percent, 25–49 percent, 50–75 percent, >75 percent). Hollow circles in the expanded inset diagrams indicate the locations of lichen height measurements.
Table 1. Models predicting lichen biomass as developed using various combinations of cover and height of the lichen layer, along with topographic plot type (type: peat plateau, collapse scar, upland forest) and the regional variables of permafrost zone (pfzone) and ecoclimatic region (eco).
Table 2. Models predicting lichen biomass as developed using various combinations of cover and genus, along with topographic plot type (type: peat plateau, collapse scar, upland forest), as well as the regional variables of permafrost zone (pfzone) and ecoclimatic region (eco).
Figure 4. Models used to predict lichen biomass within the Mackenzie Valley Permanent Monitoring Plot Network. Model 6 () is shown as two components: (a) holding the lichen height constant (at the overall mean) and (b) holding the lichen cover constant (at the overall mean). Model 2 () is depicted in (c). Topographic plot types are shown for all models as collapse scars (solid line, hollow triangles), peat plateaux (dashed line, gray squares), and upland forests (doubly dashed line, black diamonds). Both models were developed with ln-transformed data but have been back-transformed to original units for ease of interpretation.
Table 3. Models predicting lichen biomass for several common genera, using cover as the only predictive variable.
Figure 5. Lichen biomass in 2007–2008 modeled for the three topographic plot types (collapse scar, upland forest, and peat plateau) within the three permafrost zones: continuous (black), extensive discontinuous (light gray), and sporadic discontinuous (dark gray). Values represent least squares means with bars indicating standard error. Letters denote statistically significant groupings among means.
Table 4. ANOVA results (p value) for estimated lichen biomass in 2007–2008 and change in lichen biomass over the ten-year period.
Figure 6. Change in lichen biomass from 2007–2008 to 2017–2018 for three topographic plot types (peat plateau, upland forest, and collapse scar). Values represent least squares means and error bars depict 95 percent confidence intervals. Bars with different letters had significantly different means.