Figures & data
Figure 1. Map of Northeast and North Greenland with place names mentioned in the text. Yellow hatched line: Milne Land Stage moraines (Funder et al. Citation2011). The LGM extent is marked by a red hatched line.
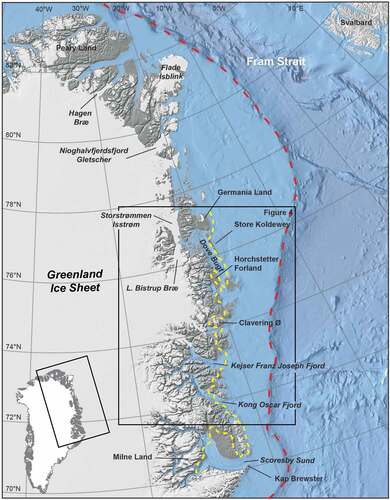
Figure 2. Glacial landscapes in Northeast Greenland. (a) Hvalrosodden in the foreground with deeply incised fjords (Mørkefjord) and plateau-like mountains in the background. (b) Blockfield on Store Koldewey. (c) Alpine topography and deep fjords in the inner parts of Kong Oscars Fjord. (d) Ice-scoured bedrock in front of Storstrømmen Isstrøm.
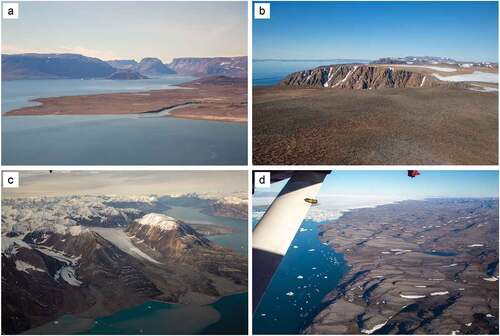
Table 1. 10Be ages from Northeast Greenland.
Figure 3. New 10Be ages from this study in Northeast Greenland. The 10Be ages are divided into three categories: outer coast sites (blue dots), intermediate sites (red dots), and ice margin sites (green dots). The LGM extent is marked by a red hatched line. The yellow hatched line and numbering indicate the geographical subdivision used in .
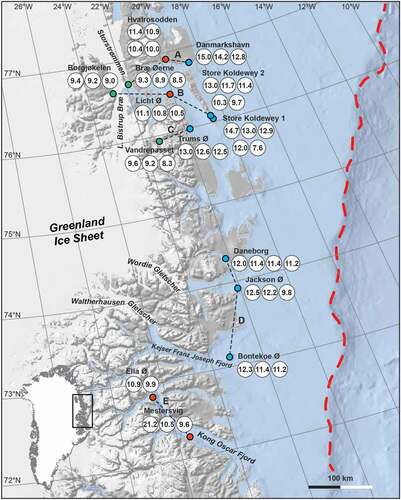
Figure 4. Sample collection in Northeast Greenland. (a) Trums Ø with Store Koldewey in the background, (b) Mestersvig, (c) Licht Ø, and (d) Nanok inner moraine (SK2) on Store Koldewey. See people for scale on the moraine. (e) Detailed map of the Nanok moraines with 10Be ages from the southern tip of Store Koldewey.
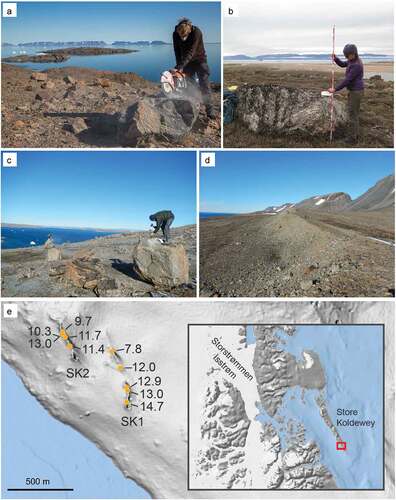
Figure 5. Probability distribution function of the 10Be ages divided into three categories from north to south: outer coast sites (blue), intermediate sites (red), and outside the present ice margin sites (green; for location, see ). Outliers identified using a χ2 test have been excluded in the plots (see ), with the exception of Danmarkshavn, where the two oldest ages are interpreted to be outliers and the youngest age as the most reliable estimate of the deglaciation age (see text for more explanation).
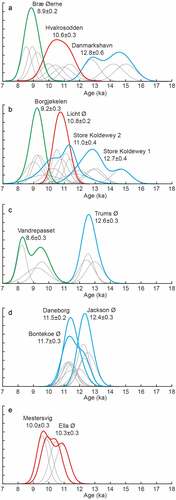
Figure 6. Map of Northeast Greenland showing the new 10Be ages (indicated with place names), as well as previously published 14C and 10Be ages concerning the deglaciation (S. Håkansson Citation1974, Citation1975; Weidick Citation1977; Björck et al. Citation1994; Landvik Citation1994; Nam et al. Citation1995; Weidick et al. Citation1996; Wagner et al. Citation2000, Citation2010; Bennike and Björck Citation2002; Christiansen et al. Citation2002; Evans et al. Citation2002; Wagner and Melles Citation2002; Klug et al. Citation2009; Bennike and Wagner Citation2012; Biette et al. Citation2020; Skov et al. Citation2020). Red hatched line indicates the maximum ice extent during the LGM. Note that at Danmarkshavn and Clavering Ø the most likely deglaciation 10Be ages are shown, whereas the oldest 10Be ages have been omitted (see text for further discussion).
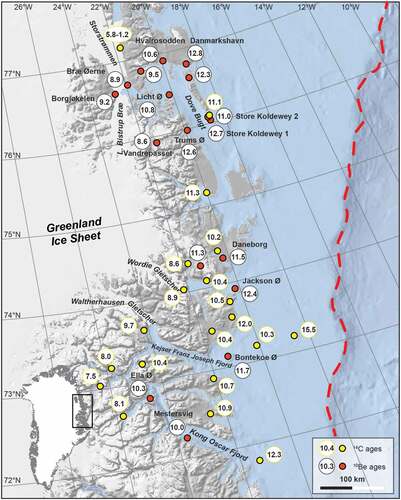
Figure 7. A data-based model of the evolution of the Greenland Ice Sheet in Northeast and North Greenland from the LGM to present. (a) LGM ice extent, (b) timing of deglaciation from shelf edge to coastline, (c) timing of deglaciation from coastline to present ice margin, and (d) timing of ice retreat inside the present ice extent. These reconstructions are based on new and existing 10Be (black font) and 14C (red font) ages (S. Håkansson Citation1974, Citation1975; Weidick Citation1976, Citation1977, Citation1978; Funder Citation1978, Citation1982, Citation1990; M. R. Kelly and Bennike Citation2008; Björck et al. Citation1994; Landvik Citation1994; Nam et al. Citation1995; Stein et al. Citation1996; Weidick et al. Citation1996; Hjort Citation1997; Wagner et al. Citation2000, Citation2010; Bennike and Weidick Citation2001; Bennike and Björck Citation2002; Christiansen et al. Citation2002; Evans et al. Citation2002; Wagner and Melles Citation2002; Nørgaard-Pedersen et al. Citation2003; L. Håkansson, Briner et al. Citation2007; Nørgaard-Pedersen, Mikkelsen, and Kristoffersen Citation2008; Klug et al. Citation2009; Bennike and Wagner Citation2012; Larsen et al. Citation2016, Citation2018, Citation2020; Biette et al. Citation2020; Skov et al. Citation2020).
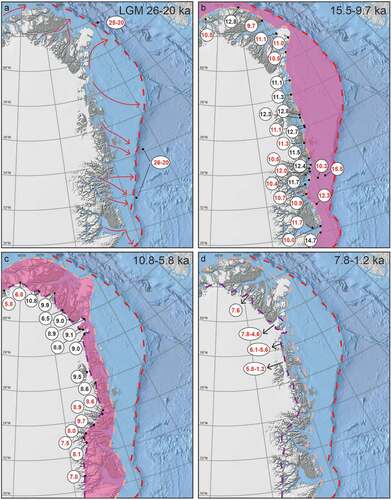
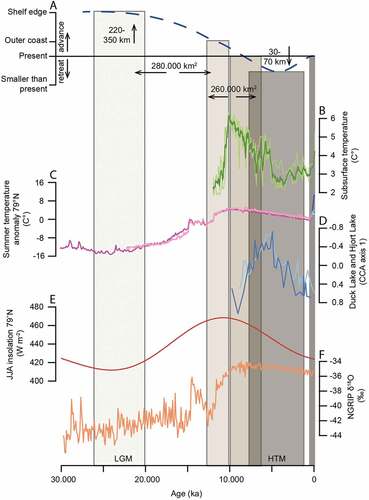
Figure 8. Ice margin fluctuations and climate variability the last 30,000 years. (a) Reconstruction of ice-marginal position from the LGM to present based on new 10Be data and existing chronologies (see text for more information). Vertical bars indicate when the ice margin was located at the shelf edge, outer coast, and present-day ice margin and was inside its present extent. The late glacial and Holocene deglaciation of the continental shelf and present-day ice-free area coincides with (b) peak subsurface temperatures based on planktic foraminiferal fauna assemblages (Werner et al. Citation2016) and (c) increased summer temperatures (Buizert et al. Citation2018). (d) The timing of maximum mid-Holocene ice retreat coincides with local chironomid-based temperature maxima at Duck (light blue) and Hjort (blue) lakes on Store Koldewey in Northeast Greenland (Schmidt et al. Citation2011). (e) Summer insolation at 79°N. (f) Ice core δ18O record from NGRIP (Andersen et al. Citation2004).