Figures & data
Figure 1. (a) Northern Canada and regions of carbonate bedrock (red). The Mackenzie River drainage area is outlined in black and shaded in opaque white. Yellow dashed lines separate the three major bedrock provinces in the Mackenzie basin. (b) Location of MTW01 in the Mackenzie Trough offshore the Mackenzie River mouth. Carbonate bearing bedrock (dolostones and limestones) in red (Harrison et al. Citation2011). Yellow area is the Mackenzie River Delta. SL = Great Slave Lake. Base map from International Bathymetric Chart of the Arctic Ocean (IBCAO) (Jakobsson et al. Citation2008).
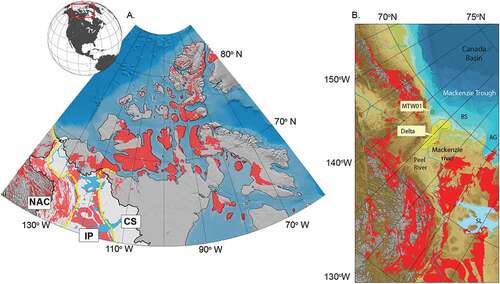
Table 1. Quantification of dolomite in sediments from the Amerasian Basin.
Table 2. Quantification of dolomite in sediments from the Amerasian Basin.
Figure 2. (a) Map of the Arctic Ocean showing sample locations and dolomite abundances reported in sediments from the Amerasian Basin and Canadian Arctic. Data are from Bazhenova, Vogt, and Stein (Citation2012) and Gamboa et al. (Citation2017). (b) Detail of the Canadian Beaufort Sea illustrating the increase in dolomite contents of surface sediments as one moves east toward the Amundsen Gulf. Additional data points from Darby et al. (Citation2011) are shown (squares). Position of sediment cores discussed in the text are indicated with triangles. CS = Chukchi Sea; ESS = East Siberian Sea; MR = Mendeleev Ridge; MB = Makarov Basin; LR = Lomonosov Ridge; AR = Alpha Ridge.
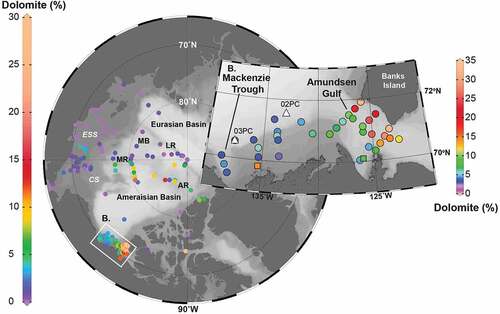
Figure 3. (a) Suspended bulk sediment load (s) and dissolved load (d) 87Sr/86Sr average ratios of main tributaries and minor tributaries from the major bedrock regimes in the Mackenzie River catchment area. ɛNd for western (W), and eastern (E) lakes in the modern Mackenzie River Delta are shown after (Vonk et al. Citation2015). Mstr = Mackenzie River mainstream. (b) Compilation of 87Sr/86Sr and ɛNd of regional bedrock terrains (North American Cordilleras: Francis and Ludden Citation1990; Carignan, Ludden, and Francis Citation1994; Abraham, Francis, and Polvé Citation2001; Slave Province: McCulloch and Wasserburg Citation1978; Cousens Citation2000; Mackenzie LIP: Dupuy et al. Citation1992; Alaska Peninsula basalts: Andronikov and Mukasa Citation2010; Akinin et al. Citation2013; Chukchi Peninsula: Ledneva, Pease, and Sokolov Citation2011).
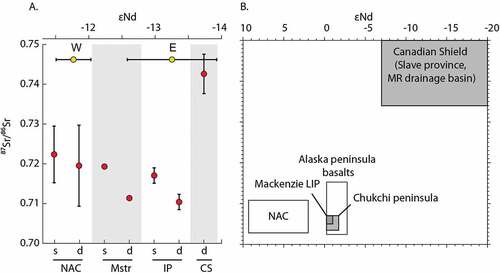
Figure 4. Lithostratigraphy of MTW01 (Moran, Hill, and Blasco Citation1989) and radiocarbon dates from O’Regan et al. (Citation2018). Units C–E were deposited in a progradational (deltaic) environment. Unit B was deposited during periods of rising sea level. Unit A was deposited in a marine environment.
Table 3. Data of εNd, 87Sr/86Sr, and concentrations of Nd and Sr.
Table 4. Grain size and mineral abundances in MTW01.
Figure 5. Stacked diffractogram from XRD of MTW01 samples. C/K = chlorite + kaolinite; I/M = illite + muscovite; Q = quartz; F = feldspars; C = calcite; D = dolomite. Note that the quartz peak is not presented in its full height.
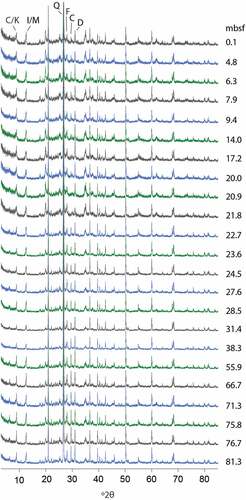
Figure 6. Results from Rietveld refinement (in wt%) of the mineral assemblage in MTW01.
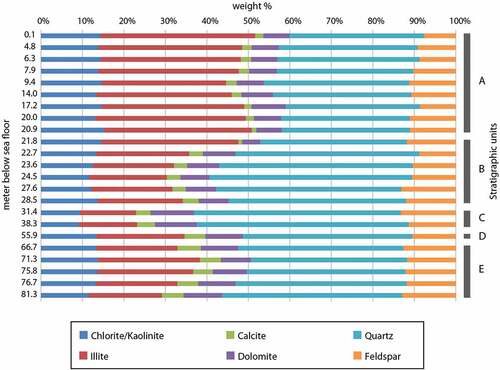
Figure 7. Borehole lithology, key mineral abundances (closed sum percent) and grain size illustrated alongside the Sr and Nd concentrations and isotopic composition. Radiocarbon age ranges (2 sigma) from O’Regan et al. (Citation2018) are shown on the right. Red = dates on mixed benthic foraminifera; blue = mollusk fragments; green = maximum limiting ages from radiocarbon dates on the particulate organic carbon content in the >63 µm size fraction.
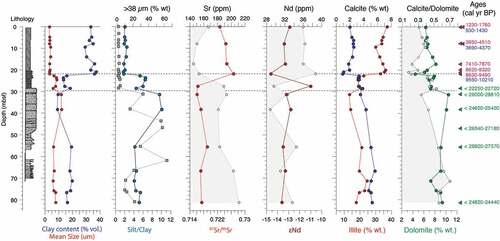
Figure 8. Clay, illite (white), and calcite (black) content versus the 87Sr/86Sr ratio for the MTW01 sediments.
Figure 9. Comparison between MTW01 and surface sediment εNd and 87Sr/86Sr from the Canadian Beaufort Sea (Asahara et al. Citation2012; Vonk et al. Citation2015; Maccali, Hillaire-Marcel, and Not Citation2018; Schwab et al. Citation2021). The box plots show the upper quartile (UQ), lower quartile (LQ), median, and range of data points not deemed as outliers. Outliers were identified as data points whose value was >UQ + 1.5 * IQD or <IQ − 1.5 * IQD, where IQD is the interquartile distance (IQD = UQ − LQ). The raw data are overlain to show the distribution. For MTW01, symbols indicate the depositional setting (progradational, transitional, marine). Annotations indicate the ɛNd values for sediments from lakes in the east and west of the Mackenzie delta and 87Sr/86Sr of suspended sediments in major tributaries of the Mackenzie River (from ).
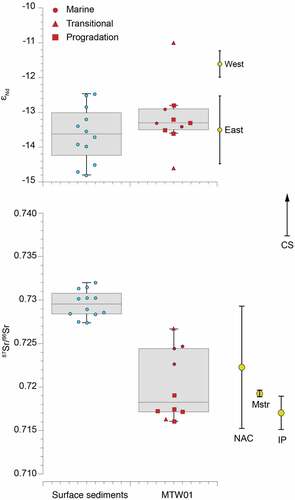
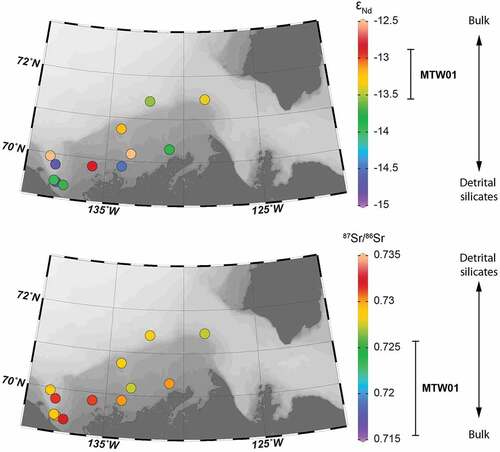
Figure 10. Spatial variations in surface sediment εNd and 87Sr/86Sr in the Canadian Beaufort Sea (Asahara et al. Citation2012; Vonk et al. Citation2015; Maccali, Hillaire-Marcel, and Not Citation2018; Schwab et al. Citation2021). The range of MTW01 sediments is shown on the right, alongside relative changes expected between the authigenic and carbonate phases and the pure detrital silicate signal (taken from tests individual extracted phases reported by Asahara et al. (Citation2012) and Schwab et al. (Citation2021). The lower 87Sr/86Sr ratios and less negative εNd signature of MTW01 sediments can both be partially explained by the influence of authigenic and carbonate phases, which were not removed in our study.