Figures & data
Table 1. Summary table of characteristics of each ecoregion with active layer monitoring sites (Ecoregions Working Group Citation1989; Ecosystem Classification Group Citation2007, Citation2010, Citation2012; Environment Canada Citation2017).
Table 2. Climate Normals (1981–2010) for five of the Environment Canada climate stations located in the Mackenzie Valley.
Figure 1. Site map with active layer monitoring sites. Sites are located both above and below treeline and monitor active layer thickness over both continuous and discontinuous permafrost. Sites with the longest records are located in the northern and southern ends of the delta. Permafrost zones from Heginbottom, Dubreuil, and Harker (Citation1995) and ecoregion boundaries from Ecosystem Classification Group (Citation2007, Citation2010, Citation2012).
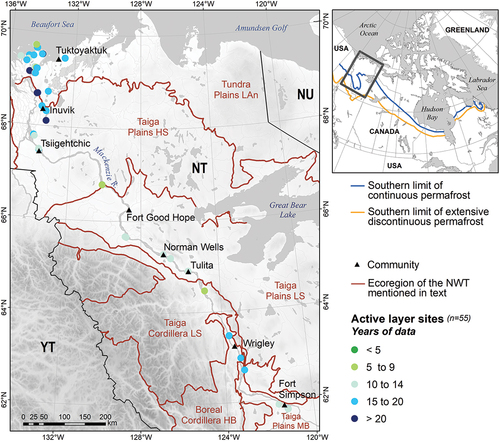
Figure 2. Site photos with representative vegetation cover for each ecoregion sampled. More site details can be found in the Supplementary Material Table S1 (Smith et al. Citation2009; Duchesne, Riseborough, and Smith Citation2014).
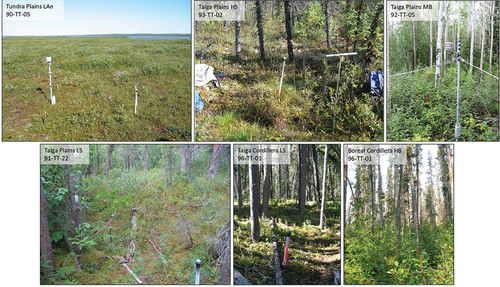
Figure 3. AMAT with the trendlines for Environment Canada climate stations (see for location) closest to active layer monitoring sites in the Mackenzie Valley (from Environment Canada Citation2017).
Figure 4. Average daily temperatures below (FDDa) and above (TDDa) for the EC stations in the Mackenzie Valley. Mean FDDa and TDDa for all years with data are represented by an X. For most stations, maximum and minimum FDDa and TDDa are shown by the ends of the whiskers. However, for some sites outliers are shown as circles after the whiskers and the ends of the whiskers instead show the value for one and a half times the interquartile range. The ends of the box show the first (25 percent) and third (75 percent) quartiles and the black line within the box shows the median. The years with the highest and lowest FDDa and TDDa are written respectively above and below the marker.
Figure 5. Average ALT for each ecoregion plotted with FDDa/TDDa and snowfall from the nearest EC station. (A) Tundra Plains LAn average ALT with FDDa/TDDa and snowfall from the Tuktoyaktuk EC station. (B) Taiga Plains HS average ALT with FDDa/TDDa and snowfall from the Inuvik EC station. (C) Taiga Plains LS average ALT with FDDa/TDDa and snowfall from the Norman Wells EC station. (D) Taiga Plains MB average ALT with FDDa/TDDa snowfall from the Fort Simpson EC station. (E) Boreal and Taiga Cordillera average ALT with FDDa/TDDa snowfall from the Fort Simpson EC station.
Figure 6. Box and whisker plot for FDDa, TDDa, FDDg, and TDDg measured at sites for each ecoregion. “g” is ground and “a” is air. X represents the mean and the circle indicates the value of outliers, which are points outside one and a half times the interquartile range.
Figure 7. Annual total snowfall data for Environment Canada stations in the Mackenzie Valley from 1990 to 2015 (Environment Canada Citation2017). Mean snowfall for all years with data is represented by an X. The maximum and minimum yearly snowfall at each station are represented by the whiskers. The black line within the box shows the median yearly snowfall at each station, and the ends of the box show the first (25 percent) and third (75 percent) quartiles. The years with maximum and minimum annual snowfall at each station are written above and below the marker, respectively.
Table 3. ALT metrics for each ecoregion.
Figure 8. Mean active layer thickness for all years and sites classified by ecoregion. Thirty monitoring sites are in the Tundra Plains LAn ecoregion, eleven are within the Taiga Plains HS ecoregion, six are in the Taiga Plains LS ecoregion, four are in the Taiga Plains MB ecoregion, and three are in the Boreal and Taiga Cordillera.
Figure 9. Mean and ranges of ALT by ecoregion along the Mackenzie Valley transect. Mean ALT for all years with data is represented by an X. The maximum and minimum ALT for all years and sites within an ecoregion are represented by the ends of the lines except for those with outliers (circles past the ends of the whiskers), in which case the ends of the whiskers represent the value one and a half times the interquartile range. The black line within the box shows the median annual ALT for each ecoregion, and the ends of the box show the first (25 percent) and third (75 percent) quartiles. The year and site with the thickest and thinnest active layers are written respectively above and below the marker. Some sites maintained the thickest or thinnest active layer for multiple years, and for these sites the years indicate this duration. More details on the individual stations can be found in the Supplementary Material in Table S1.
Table 4. Average nf and nt values and ALT for sites with data.
Figure 10. Box and whisker plot for the freezing n-factor (nf) and the thawing n-factor (nt) for each ecoregion. X represents the mean and the circle indicates the value of outliers (one and a half times the interquartile range).
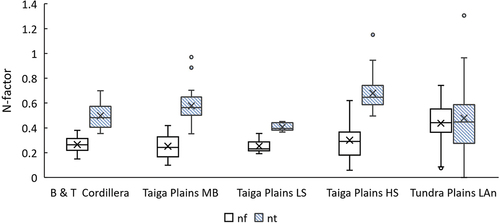
Figure 11. Average ALT, TDDg, and nt and FDDg and nf for the preceding year. Slope and slope error for each series are given. (A) Site 90-TT-04 in the Tundra Plains LAn ecoregion. (B) Site 91-TT-13 in the Taiga Plains HS ecoregion. (C) Site 91-TT-22 in the Taiga Plains LS ecoregion. (D) Site 92-TT-04 in the Taiga Plains MB ecoregion. (E) Site 92-TT-10 Boreal and Taiga Cordillera.
Figure 12. Comparison of ALT range and subsidence for each site classified based on substrate texture (Geological Survey of Canada data files updated from S. L. Smith, Riseborough et al. Citation2009). Subsidence was measured cumulatively over all years of observations. Range of ALT refers to the difference between the maximum and minimum ALT for all years at a site. Red symbols indicate the average subsidence for that substrate.
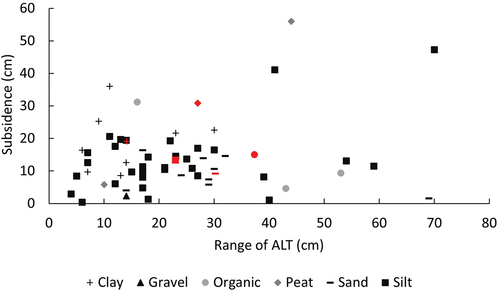
Figure 13. Three-year running means for average active layer thickness for each ecoregion. R2, slope, and slope error are given for each series.