Figures & data
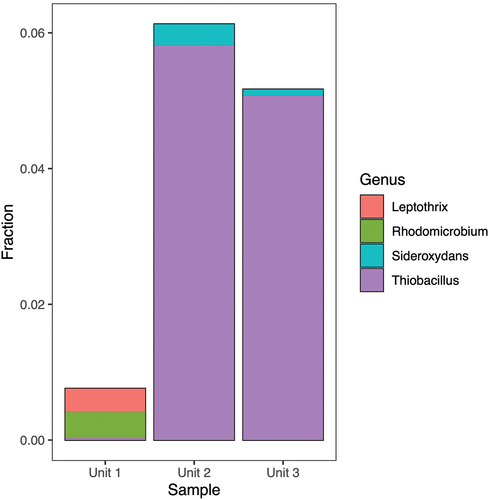
Figure 1. Adventdalen and the sampling site in Bolterdalen (www.toposvalbard.npolar.no).
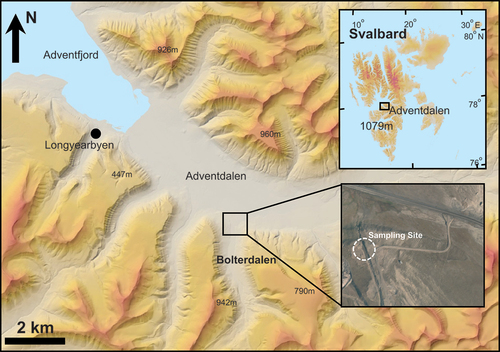
Figure 2. Detail of the section sampled for the study, showing three discrete sedimentary units.
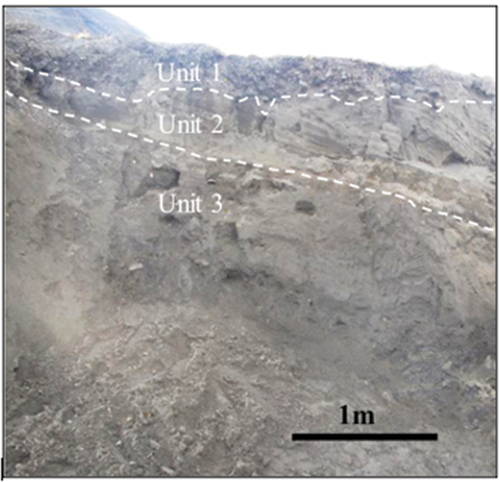
Table 1. Main sedimentological characteristics of the three sedimentological units.
Figure 3. Fe(II) concentration data and linear models for iron reduction rates for incubations from three geological units with three treatments; 21°C (red circles), 4°C (blue circles), and 4°C with OM amendment (magenta circles). Points show mean values (n = 3 for each point), with error bars showing a single standard deviation. The rates (slopes) were significantly different for Unit 1, where the 4°C treatment resulted in a significantly slower rate than the other two treatments. No other rates were significantly different from one another for a given unit. Note that the linear model is based on the entire data set, not just the mean values displayed here.
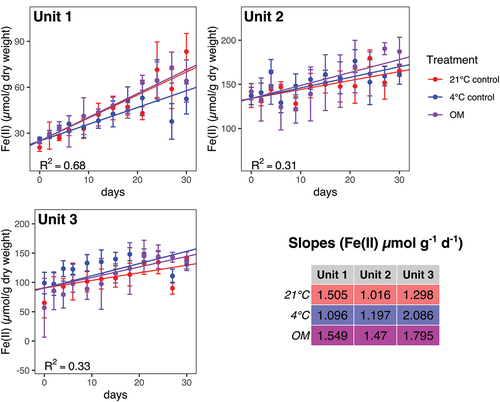
Table 2. Production rates (µmol g−1 dw d−1) of CO2 from incubation experiment 2.
Table 3. 16S rDNA gene copy number of Bacteria and Archaea per gram of sediment dry weight quantified after thirty days of incubation under three conditions, 4°C, 4°C with addition of organic matter, and 21°C, in the three units: Unit 1 (diamicton), Unit 2 (beach), Unit 3 (delta).
Table 4. The ratio between amount of CO2 determined from Fe(II) production rates assuming that Fe(III) reduction was exclusively heterotrophic and CO2 production determined from CO2 measurements in the headspace of the slurries vessel.
Figure 4. CH4 production under three conditions (magenta circle: 4°C with addition of organic matter, blue circles: 4°C, red circles: 21°C) in the three units: (a) Unit 1 (diamicton), (b) Unit 2 (beach), (c) Unit 3 (delta). Each data point is a mean, calculated from triplicates. Concentration is shown in nanomoles per gram dry weight.
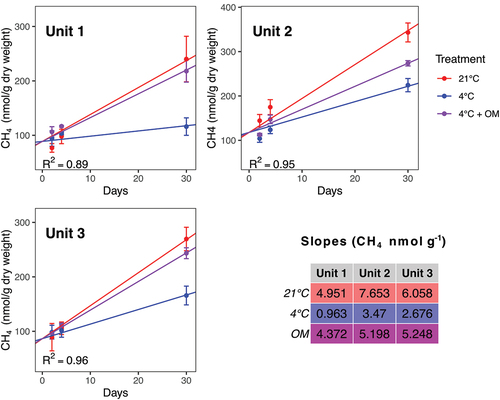
Figure 5. Taxonomic assignment of relative abundance of bacterial 16S rRNA gene sequences at the phylum level of the three units (1 = diamicton, 2 = beach, 3 = delta). “Others” combines minor phyla never exceeding 5 percent of any sample.
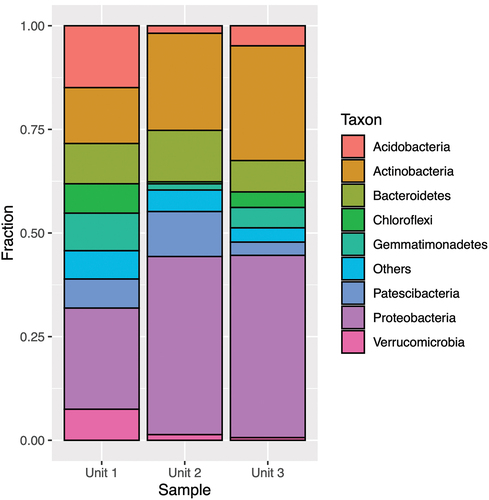
Figure 6. Taxonomic assignment of relative abundance of bacterial 16S rRNA gene sequences at the class level of the three units (1 = diamicton, 2 = beach, or 3 = delta). “Others” combines minor classes never exceeding 5 percent of any sample.
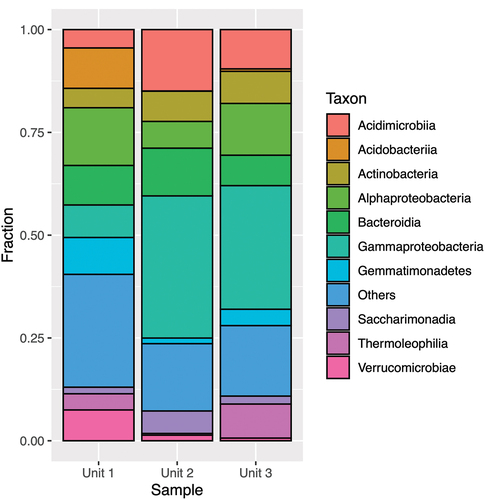
Figure 7. Fractional abundance of potential Fe(III)-reducing bacterial genera identified using 16S rRNA gene sequencing.
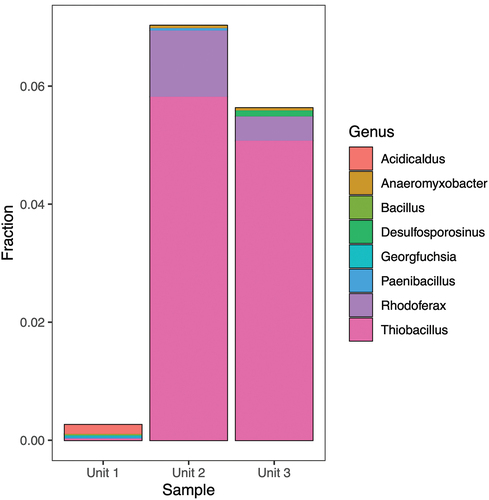
Figure 8. Fractional abundance of potential Fe(II)-oxidizing bacterial genera identified using 16S rRNA gene sequencing.