Figures & data
Figure 1. McMurdo Dry Valleys: Landsat Image Mosaic of Antarctica (LIMA) imagery (overview map) and Worldview 2 imagery (inset). Sample locations are displayed on the inset. The dashed green line is a ground-penetrating radar survey where no massive ice was detected, and red represents areas where buried ice was detected. Shaded orange regions on the overview map and the orange outline on inset represent inferred extent of ice-cored Ross Sea Drift (RSD; both data sets used with permission from Levy et al. Citation2018).
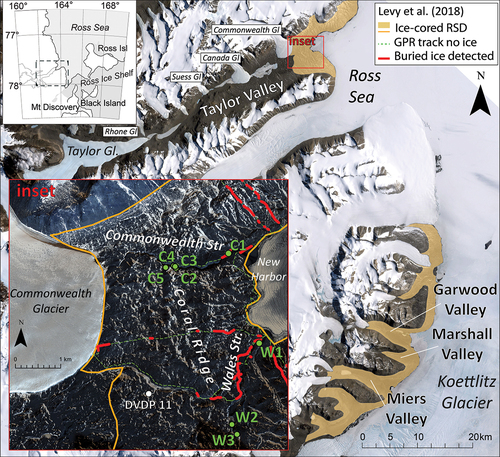
Figure 2. (a) Wales Stream sample site, facing southeast. White arrow indicates buried ice, covered in till, actively being undercut by Wales Stream above the delta where sample W1 was collected. New Harbor camp is out of the frame to the left. (b) Commonwealth Stream sample site facing northwest toward the accumulation zone of Commonwealth Glacier. White arrow indicates east–west trending horizontally continuous layer of buried ice near Commonwealth Stream along Coral Ridge from which samples C3 bottom, middle, and top were collected.
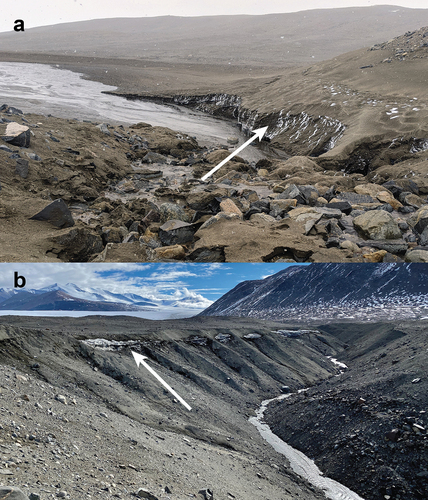
Table 1. δ18O and δ2H of water of buried ice in eastern Taylor Valley. The three samples for C3 were collected from the same location, 1 m apart vertically; the two samples for C5 were collected from the same location several meters apart.
Figure 3. Buried ice δ18O and δ2H of water from massive buried ice in the RSD along Commonwealth and Wales streams in eastern TV (this study) and GV. TV ice and snow from previous studies are included for comparison. Commonwealth Glacier (eastern TV alpine glacier) and Taylor Glacier (western TV outlet of the EAIS) surface means and ranges are represented by a symbol and shaded ovals. Fresh (summertime) snow from Canada and Taylor Glaciers range is represented by the unshaded oval (Gooseff et al. Citation2006). Ice-cemented permafrost δ18O is the top 80 m (down to sea level) of the DVDP core 11. WAIS Divide and Taylor Dome ice cores are included, and the LGM period of the WAIS core is highlighted, the time during which the Ross Sea ice sheet was at its maximum extent in Taylor Valley, 18.7 to 12.8 ka (Hall et al. Citation2015). LMWL = local meteoric water line. GMWL = global meteoric water line. TAM = Transantarctic Mountains. Data sources: 1Gooseff et al. (Citation2006); 2Levy et al. (Citation2013); 3Pollard, Doran, and Wharton (Citation2002); 4Grootes and Stuiver (Citation1986); 5Morgan (Citation1982); 6Grootes et al. (Citation2001); 7Stuiver, Yang et al. (Citation1981); 8WAIS Divide Project Team (Citation2013); 9Gow and Epstein (Citation1972).