Figures & data
Figure 1. Location of the research study area in Italy and in the northwestern Italian Alps (www.pcn.minambiente.it), aerial overview of the study area (orthoimage year 2006; coordinate system WGS84/UTM 32 N), and location of the seven permanent study sites at the LTER Site Angelo Mosso Scientific Institute.
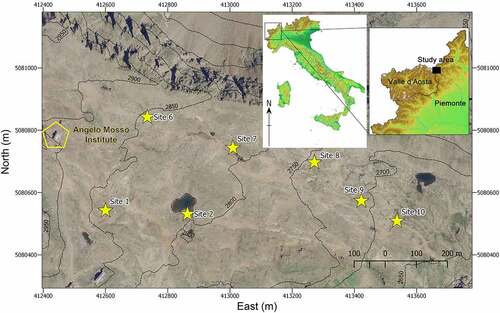
Table 1. Weather conditions recorded by the Automatic Weather Station during the experimental period (2016–2019) and historical time frame (2007–2019).
Figure 2. (A) Air temperature (mean daily values), snow depth, and rainfall recorded at the Automatic Weather Station (AWS) from 1 October 2015 to 30 September 2019 and (B) soil temperature (10 cm depth, mean daily values) at the seven study sites.
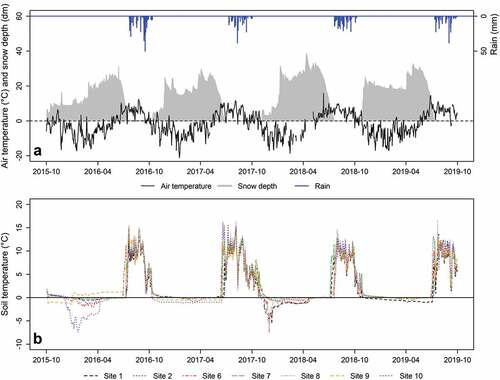
Table 2. Selected climatic, pedoclimatic, and vegetation variables used in generalized linearmixed models (GLMM).
Table 3. Descriptive statistics for all variables used in the generalized linearmixed models (GLMMs).
Figure 3. Interannual variability of soil C and N forms in the seven snowbed communities. Sampling periods refer to different moments of sampling, which occurred every year within July, August, and September.
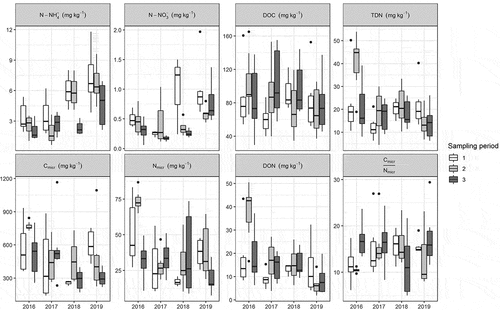
Figure 4. Phenology of the species Salix herbacea throughout the four-year monitoring period. Phenophases are indicated on the y axis as a progressive number following the adaptation of the Biologische Bundesanstalt, Bundessortenamt and Chemical industry scale (Hack et al. Citation1992); day of year is reported as a variable on the x axis. For every year, the lines represent the median phenophase of the seven sites on each survey date.
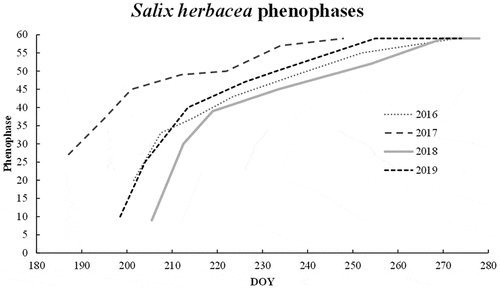
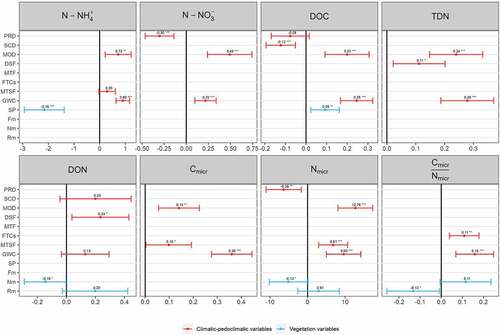
Figure 5. Standardized effects of climatic-pedoclimatic and vegetation variables on soil C and N forms derived from generalized linear mixed models. For each model, the effects (standardized coefficient) of each independent variable are represented by a point symbol and their confidence intervals by a horizontal line. The independent variables are listed on the y axis: PRD, SCD, MOD, DSF, FTCs, MTF, MTSF, ISF, GWC, SP, Fm, Nm, and Rm. When the horizontal line intersects the vertical black line (representing a null effect), it means that the independent variable has no significant effect. Conversely, when the confidence interval line does not intersect the vertical black line, the independent variable has a significant effect. Significance: *p < 0.05, **p < 0.01, ***p < 0.001; the absence of asterisks means that there is no significant effect.