
Figures & data
Table 1. Average and standard deviation of variety yield, flowering and maturity dates, and the number of testing years of eight varieties of barley, four of oat, and three of wheat in Delta Junction and Fairbanks, Alaska.
Figure 1. Average yield change per year of barley (‘Albright,’ ‘Datal,’ ‘Eero,’ ‘Finaska,’ ‘Lidal,’ ‘Otal,’ ‘Thual,’ and ‘Weal’) (red), oat (‘Athabasca,’ ‘Cascade,’ ‘Nip,’ and ‘Toral’) (green), and wheat (‘Ingal,’ ‘Nogal,’ and ‘Roblin’) (blue) in (a) Fairbanks and (b) Delta Junction from 1978 to 2018. The bars indicate 95 percent credible interval of yield loss based on a Bayesian simulation (n = 500).
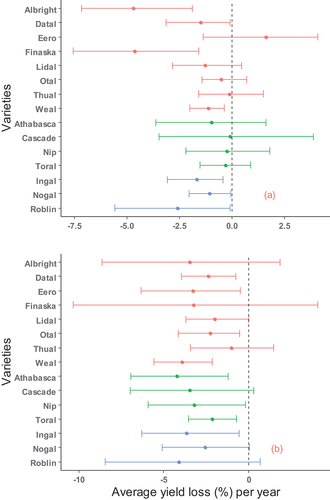
Figure 2. Median cultivar yield loss (%) for 1°C (average, maximum, and minimum temperature) or 1 cm cumulative precipitation increase over the period June to July from 1978 to 2018 in Fairbanks (a, c, d) and Delta Junction (b, d, f). ‘Albright,’ ‘Datal,’ ‘Eero,’ ‘Finaska,’ ‘Lidal,’ ‘Otal,’ ‘Thual,’ and ‘Weal’ are barley (red); ‘Athabasca,’ ‘Cascade,’ ‘Nip,’ and ‘Toral’ are oat (green); ‘Ingal,’ ‘Nogal,’ and ‘Roblin’ are wheat (blue). ∆Yield indicates percentage loss of yield. Bars represent 95 percent credible interval calculated from Bayesian simulation (n = 500).
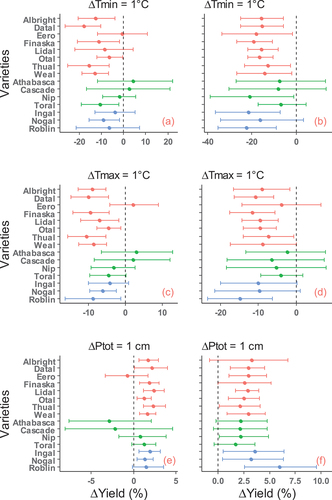
Table 2. The equations and R2 of the best-fitted cultivar models derived from full models ∆LogY = ∆Tmax + ∆Tmin + ∆Ptot.