
Figures & data
Figure 1. Map showing study area location and the channels through the CAA and Nares Strait connecting the Arctic Ocean to northern Baffin Bay and the general ocean circulation with Polar water/Arctic surface water depicted by white arrows and Atlantic water currents shown as red arrows. M’S = M’Clure Strait; VS = Viscount Melville Sound; BS = Barrow Strait; LS = Lancaster Sound; JS = Jones Sound; SS = Smith Sound; BC = Baffin Current; WGC = West Greenland Current, AIC = Agassiz Ice Core. (b) Green box shows area of . Bathymetry data from the International Bathymetric Chart of the Arctic Ocean (Jakobsson et al. Citation2012).
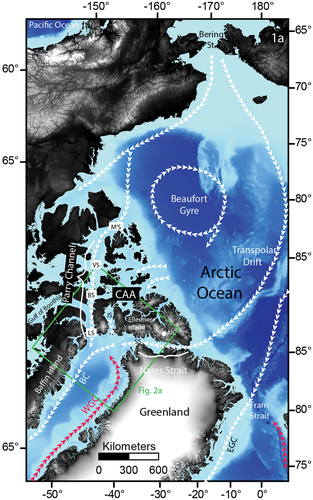
Figure 2. (a) Location map of the study area showing the cores of this study in red: 59=2008029-59CC, 49=2008029-49CC, 64=2013019-64PC and cores mentioned in the text shown in yellow: 04=97022-004, 144=86027-144, 154=86027-154, 10=2011804-0010, 34=2008029-034, 11=LSSL2001-014PC, and TC; 2B = AMD14-Kane2B. NBI = Navy Board Inlet; BT = Buchan Trough; ST = Scott Trough. Squares surrounding core sites denote site studies of multibeam bathymetry data at each core site. Dashed black line shows the average June extent of the NOW. Dashed yellow line denotes maximum ice extent mapped for the LGM after Li, Piper, and Campbell (Citation2011) and Brouard and Lajeunesse (Citation2017). Solid yellow lines in outer Lancaster Sound (Furze et al. Citation2018) and in Barrow Strait (Pieńkowski et al. Citation2012, Citation2014) mark inferred LSIS retreat positions. Bathymetry data from the International Bathymetric Chart of the Arctic Ocean (Jakobsson et al. Citation2012). (b) Site study for 64PC showing the grounding zone wedge formed by the Pond Inlet Ice Stream and retreat moraines from ice retreat that occurred prior to the results shown in the upper 441 cm of core 64PC in this article. (c) Site study for 49CC showing iceberg scours. Conductivity, temperature, depth profile taken 430 m SE of 49CC (48CTD) during the 2008029 CSGS Hudson cruise (Campbell and de Vernal Citation2009). WGIW = West Greenland Intermediate Water. (d) 59CC site study showing the locations of the two grounding zone wedges in Lancaster Sound west of the core site.
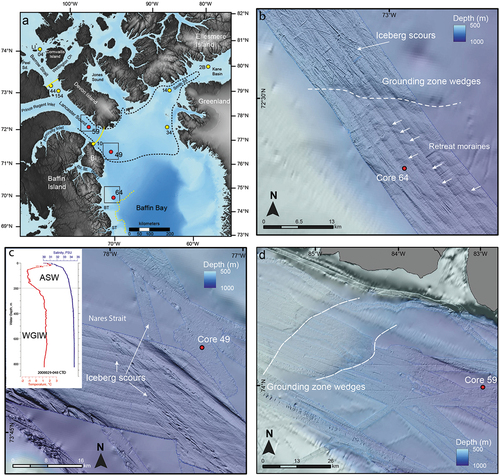
Table 1. Core site information and core top correlations. Splice depth determination info in Table S1.
Table 2. Radiocarbon dates and calibrated ages used in this study.
Table 3. Benthic foraminifera environmental preferences.
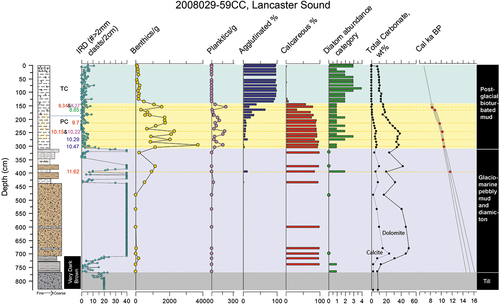
Figure 3. Basic stratigraphy and proxies for (a) 59CC and (b) 49CC to illustrate the environmental changes in Lancaster sound, from deglaciation onward. The gray box marks the subglacial till of the Baffin Shelf drift. The blue box coincides with glaciomarine sediments of the Davis Strait silt. The yellow and green boxes coincide with postglacial sediments of the Tiniktartuq Mud (Bennett et al. Citation2014). All proxies are shown against composite core depth. The data are presented left to right as core log, calibrated radiocarbon dates (Marine13 data) on benthic foraminifera (red), planktic foraminifera (pink), mollusks (blue), and seaweed macrofossils (green); >2 mm clast counts (= IRD), benthic forams/g, planktic forams/g, agglutinated forams percentage, calcareous forams percentage, the diatom abundance category, the calcite and dolomite weight percentages, and the age model with 2σ errors and showing ages not included in the age model as gray circles.
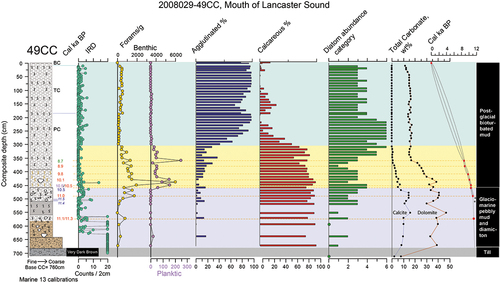
Figure 4. Basic stratigraphy and proxies for 64PC. The blue box denotes glaciomarine sediments. The yellow and green boxes denote postglacial sediments. The data are presented left to right as core log, calibrated radiocarbon dates (Marine13 data) on benthic foraminifera (red), planktic foraminifera (pink), mollusks (blue), and seaweed macrofossils (green), followed by benthic forams/g, planktic forams/g, agglutinated forams percentage, calcareous forams percentage, the diatom abundance category, the calcite and dolomite weight percentages, and the age model with 2σ errors and showing one age that is not included in the age model (gray circle).
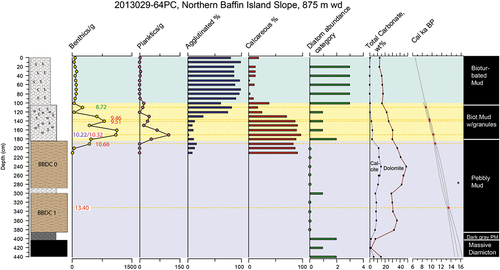
Figure 5. Examples of key lithofacies in cores 49CC, 59CC, and 64PC. (a) X-radiograph of bioturbated mud from 0 to 30 cm in 49CC, b = examples of burrows. (b) X-radiograph of bioturbated mud, examples of pyritized burrows = p, 390–420 cm in 49CC. (c) X-radiograph of transition to bioturbated mud marking open Parry Channel in 59CC, 300–330 cm. (d) Photograph showing transition from very dark brown glaciomarine sediments to tan calcareous pebbly mud of BBDC 1; 59CC 690–710 cm. (e) Transition from very dark brown till to very dark brown glaciomarine sediments in 59CC 755–784 cm, photo, left and x-radiograph, right. (f) Transition from tan calcareous pebbly mud of BBDC 0 to bioturbated mud in 64PC, 173–205 cm, marking opening of Parry Channel. (g) Very dark gray pebbly mud transition to tan calcareous pebbly mud of BBDC 1 at 385 cm in 64PC interval from 361 to 392 cm shown in photo, left, and x-radiograph, right. (h) Abrupt transition at 680 cm in 49CC from very dark brown till to tan calcareous pebbly mud of BBDC 0 marking the start of glaciomarine sedimentation after iceberg scour to till; shown is interval from 660 to 690 cm with photo, left, and x-radiograph, right.
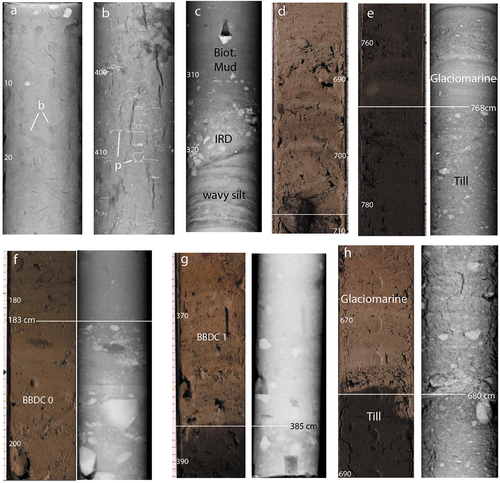
Figure 6. Mineral cluster membership shown as proportions for each mineral facies presented alongside the four basic intervals denoted by the color boxes. The five mineral clusters denote the five mineral facies (MF) in the three cores.
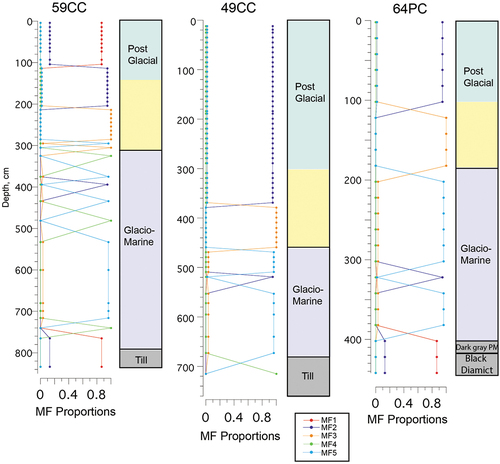
Figure 7. Biplots of the first two principal component axes in (a) 59CC, (b) 49CC, and (c) 64PC, showing the sample scores (blue dots) and the species loadings (red triangles) on the axes. Blue labels denote agglutinated species and red labels denote calcareous species. Species loadings were scaled by 2.13 in (a), by 1.32 in (b), and by 2.77 in (c).
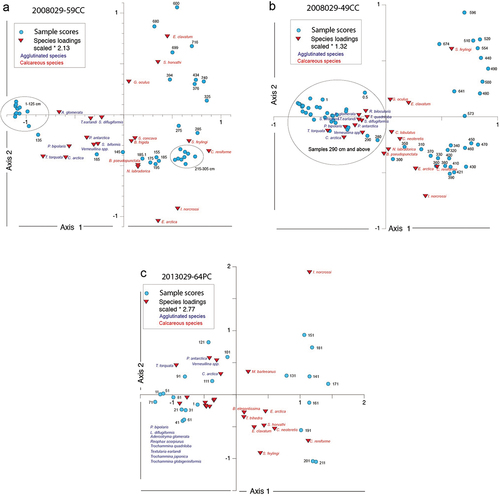
Figure 8. The downcore PCA Axis 1 (blue) and Axis 2 (red) scores ranged against the lithofacies, calibrated 14C ages, and benthic species percentages of the most important species in the PCA analysis in 59CC. Color schemes are the same as those defined in . Thin black lines running through plots denote faunal zones (FZs) defined by cluster analysis. FZ shown on far right.
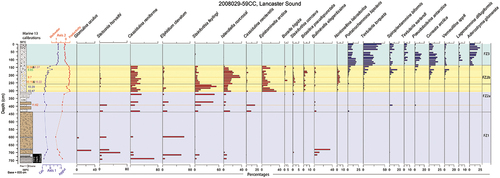
Figure 9. The downcore PCA Axis 1 (blue) and Axis 2 (red) scores ranged against the lithofacies, calibrated 14C ages, and benthic species percentages of the most important species in the PCA analysis in 49CC. Color schemes are the same as those defined in . Thin black lines running through plots denote FZs defined by cluster analysis. FZ shown on far right.
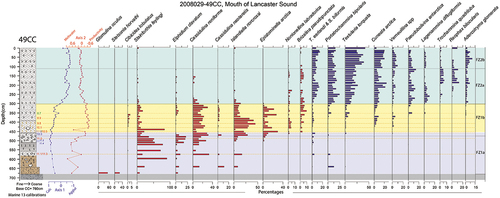
Figure 10. The downcore PCA Axis 1 (blue) and Axis 2 (red) scores ranged against the lithofacies, calibrated 14C ages, and benthic species percentages of the most important species in the PCA analysis in 64PC. Color schemes are the same as those defined in . Thin black lines running through plots denote FZs defined by cluster analysis. FZ shown on far right.
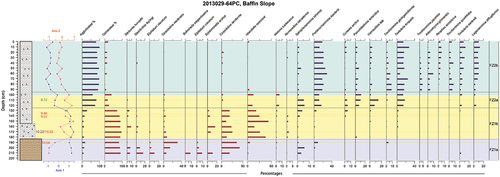
Figure 11. Lightness (L*), total carbonate, and kaolinite weight percentage against age in the three cores. Age control is shown by black triangles. Box colors as defined in . The brown bars indicate the mean ages of the beginning and end of BBDC 1 and BBDC 0 on the 64PC age model.
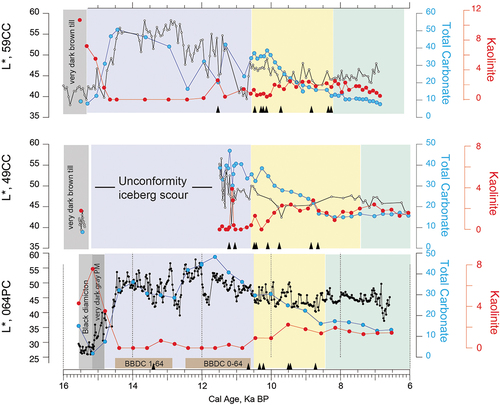
Figure 12. LSIS retreat within Lancaster Sound. Ice retreat positions are interpreted from mapped glacial features and radiocarbon dating of sediment core lithofacies. Bedrock geology is adapted from Harrison, Brent, and Oakey (Citation2011). Superscript letters beside ice retreat ages attribute the ages to the following publications: 1 = Dalton et al. (Citation2020); 2 = McNeely et al. (Citation2013); 3 = MacLean et al. (Citation2017); 4 = Pieńkowski et al. (Citation2014); 5 = Brouard and Lajeunesse (Citation2017); 6 = Li, Piper, and Campbell (Citation2011). Glacier features first published in this study and ice retreat ages defined in this study have no superscript designation. PRI = Prince Regent Inlet; LI = Lowther Island. Red dotted line and gray solid lines demarcate ice margins at 10.9 and 11. 8 cal ka BP, respectively, from Dalton et al. (Citation2020).
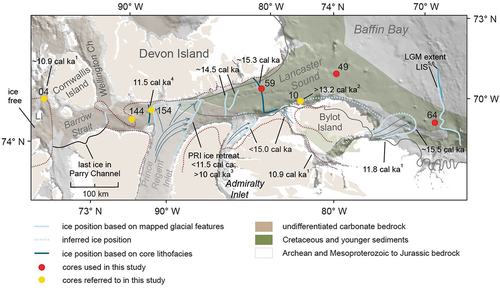
Figure 13. Proxies in core 59CC against age showing how the deglaciation and channel opening align with key climate events and environmental interpretations from the cores. From bottom to top of figure: X-axis indicates timing of stadial and interstadial events: O’stD = Oldest Dryas; Bø = Bølling; Al = Allerød; YD = Younger Dryas; OD = Older Dryas; IACP = Interallerød Cold Period; PBO = Preboreal Oscillation. Greenland ice core δ18O record from Northern Greenland Ice Core Project, NGRIP (Rasmussen et al. Citation2007); June insolation at 65°N in W/m2 (Berger and Loutre Citation1991); Agassiz ice core annual temperature based on elevation corrected δ18O data (Lecavalier et al. Citation2017). Core 59CC >2 mm IRD counts; total carbonate (calcite plus dolomite from quantitative XRD data) versus lightness L* data; planktic forams per gram and benthic foram assemblage loadings on Axis 2. Top of diagram shows the timing of BBDC 1 and 0 from core 64PC (this article) in brown and the timing of ice retreat from various core sites along Lancaster Sound as shown in . PCh = Parry Channel opening; NSt = Nares Strait opening.
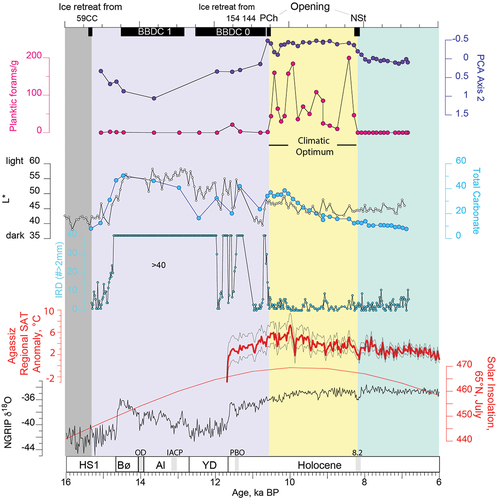
Table 4. Event timeline and boundary ages.
Supplemental Material
Download Zip (781 KB)Data Availability Statement
The data that support the findings of this study are openly available in the NSF Arctic Data Center at http://doi.org/10.18739/A2GM81Q31.