Figures & data
Figure 1. (a) Overall map showing the location of Svalbard and the study area. (b) Bathymetric map showing the main surface currents, West Spitsbergen Current (WSC) and East Spitsbergen Current (ESC). (c) Bathymetric map of Krossfjorden showing the core site (green filled circle) and additional surface currents, Spitsbergen Polar Current (SPC) and Spitsbergen Trough Current (STC). Additionally, dashed purple line indicates the inflowing Atlantic Water (AW) to Krossfjorden at deep to intermediate water depths. White dashed line indicates the direction of meltwater from the glacier front.
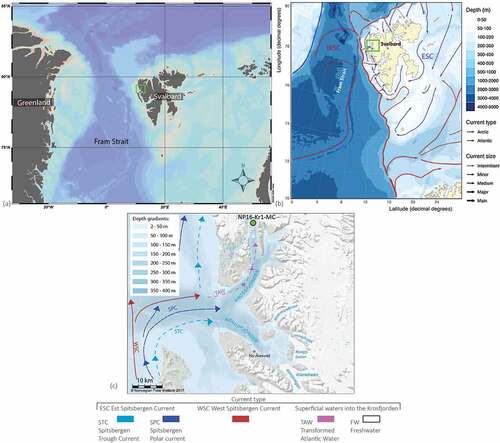
Figure 2. Close-up of the inner part of Krossfjorden showing the site of NP16-Kro1-MC A and the glacier front positions of Lilliehöökbreen (König, Kohler, and Nuth Citation2013; Moholdt et al. Citation2021). Scale is indicated in the figure.
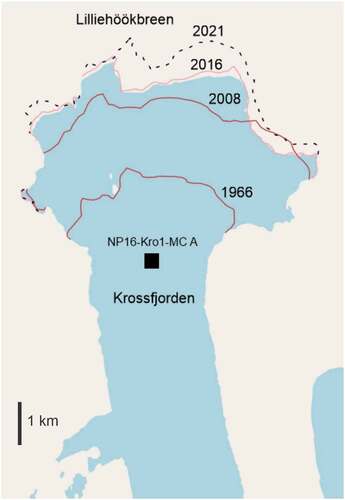
Figure 3. Temperature (red line) and salinity profile (blue line) from CTD (conductivity, temperature and density) cast carried out prior to coring, 2 August 2016 (Husum and Wold Citation2016).
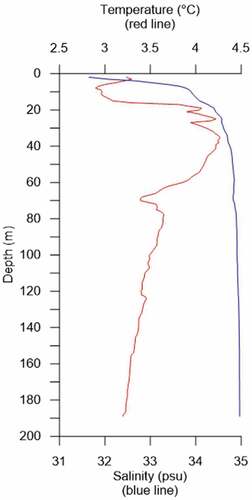
Table 1. Time markers (core depth and age) used for developing depth–age model by Guruvayoorappan et al. (Citation2020).
Figure 4. Concentration (individuals * g−1) and flux (individuals * cm−2 * year−1) of benthic foraminifera in core NP16-Kro1-MC A, percentage of calcareous and agglutinated forms, and diversity parameters. The shaded areas show the fauna assemblage zones identified by cluster analysis.
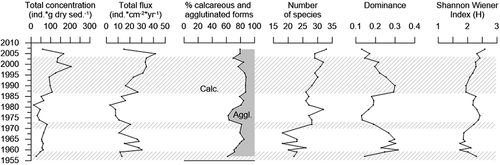
Figure 5. Stratigraphically constrained cluster analysis including all samples.
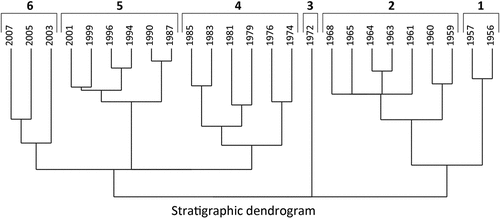
Figure 6. (a) Relative abundance (black line, upper x-axis) and flux (gray area, lower x-axis) of main calcareous species. The upper panel show species that constitutes a minimum of 2 percent of the fauna assemblage in at least two samples. The lower panel show species that constitutes a minimum of 1 percent of the fauna assemblage in at least two samples. The shaded areas show the fauna assemblage zones identified by cluster analysis. (b) Relative abundance (black line, upper x-axis) and flux (gray area, lower x-axis) of main agglutinated species that constitutes a minimum of 1 percent of the fauna assemblage in at least two samples. The shaded areas show the fauna assemblage zones identified by cluster analysis.
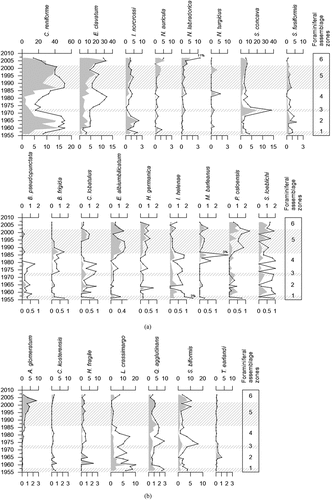
Figure 7. Stable isotope analysis (δ13C, δ18O) of NP16-Kro1-MC A. The shaded areas show the fauna assemblage zones identified by cluster analysis.
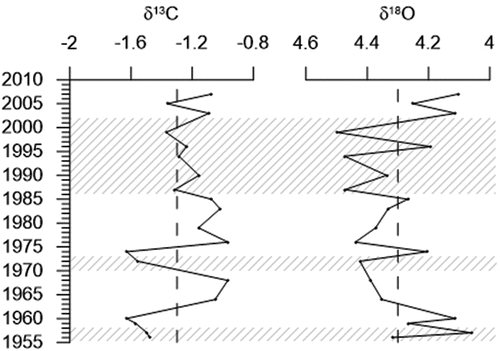
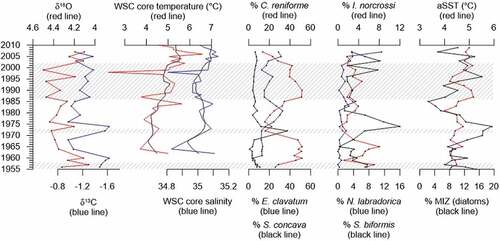
Figure 8. (a) Stable isotopes (δ13C, δ18O) from NP16-Kro1-MC A. (b) Temperature and salinity in the core of West Spitsbergen Current measured during late summer (Norwegian Polar Institute Citation2022a, Citation2022b). (c), (d) Selected benthic foraminiferal species (%) from NP16-Kro1-MC A. (e) Reconstructed SST (August) and MIZ diatoms (%) from Guruvayoorappan et al. (Citation2020). The shaded areas show the fauna assemblage zones identified by cluster analysis.