Figures & data
Figure 1. Map of the study area in the Beaufort Delta region. (a) The extent of main map (red) in North America and (b) an enlargement of Herschel Island (the green rectangle on the main map). (c) A photograph of typical terrain and ground cover on Banks Island (photo by T. Lantz). (d) A photograph of typical terrain and ground cover on the Tuktoyaktuk Coastlands (photo by J. Seider).
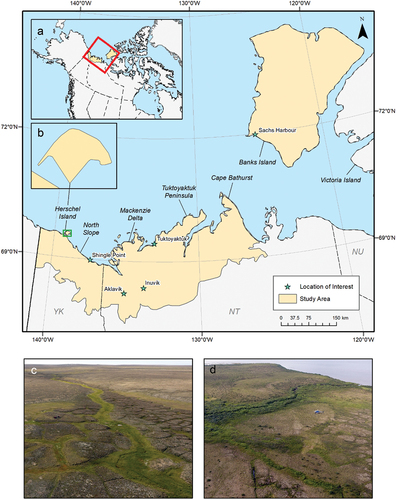
Table 1. Percent of all plots sampled with observed presence (prevalence) of modeled species from field survey data.
Table 2. Bioclimatic variables from WorldClim (Fick and Hijmans Citation2017) used in this analysis.
Table 3. Model descriptions.
Table 4. Description of performance metrics used for model evaluation.
Table 5. Mean and standard deviation of habitat suitability across the entire study area for each model under current (1970 to 2000) and future (2061 to 2080) climate.
Figure 2. Ensemble habitat suitability maps (gray box) for alder (Alnus viridis) projected under current and future climate conditions using true absence and pseudo-absence models. Banks Island is inset over the mainland portion of the study area for enhanced visualization. Plots (A)–(D) correspond to differences between climate projections and data types along the columns and rows.
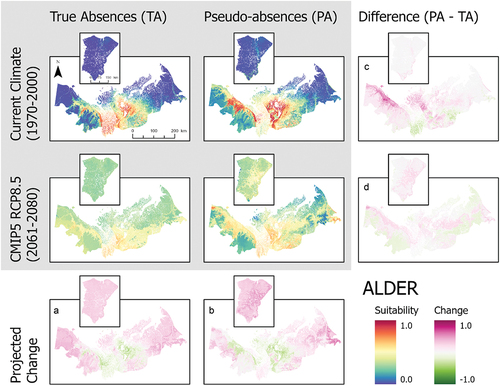
Figure 3. Ensemble habitat suitability maps (gray box) for birch (Betula nana and B. glandulosa) projected under current and future climate conditions using true absence and pseudo-absence models. Banks Island is inset over the mainland portion of the study area for enhanced visualization. Plots (A)–(D) correspond to differences between climate projections and data types along the columns and rows.
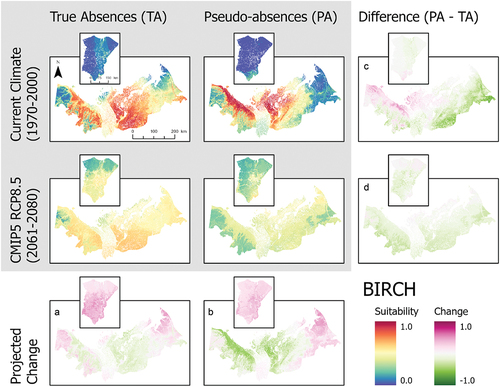
Figure 4. Ensemble habitat suitability maps (gray box) for marsh Labrador tea (Ledum decumbens) projected under current and future climate conditions using true absence and pseudo-absence models. Banks Island is inset over the mainland portion of the study area for enhanced visualization. Plots (A)–(D) correspond to differences between climate projections and data types along the columns and rows.
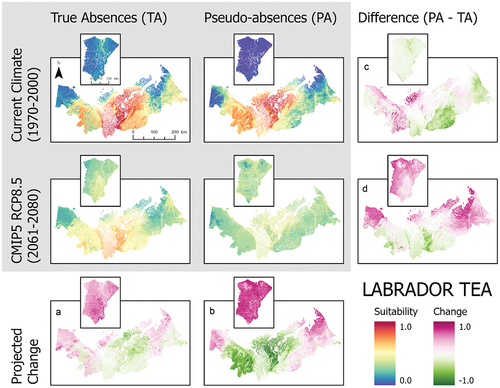
Figure 5. Ensemble habitat suitability maps (gray box) for bog bilberry (Vaccinium uliginosum) projected under current and future climate conditions using true absence and pseudo-absence models. Banks Island is inset over the mainland portion of the study area for enhanced visualization. Plots (A)–(D) correspond to differences between climate projections and data types along the columns and rows.
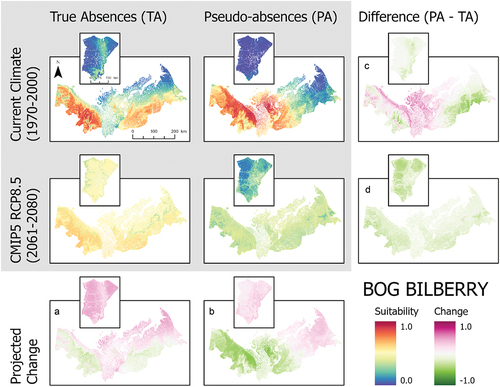
Figure 6. Ensemble habitat suitability maps (gray box) for lingonberry (Vaccinium vitis-idaea) projected under current and future climate conditions using true absences and pseudo-absences models. Banks Island is inset over the mainland portion of the study area for enhanced visualization. Plots (A)–(D) correspond to differences between climate projections and data types along the columns and rows.
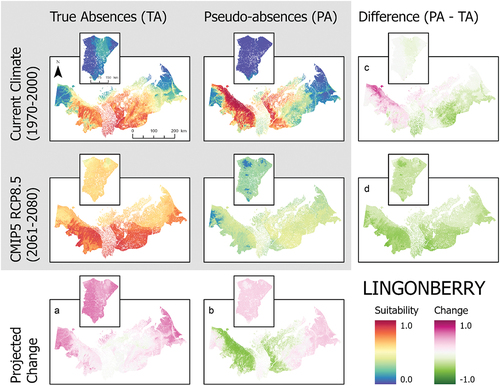
Table 6. Ensemble model performance metrics calculated using independent data.
Table 7. Ranking of the top five variables for each model in order of importance (1 is most important) for each species for both true absence (TA) and pseudo-absence (PA) models.
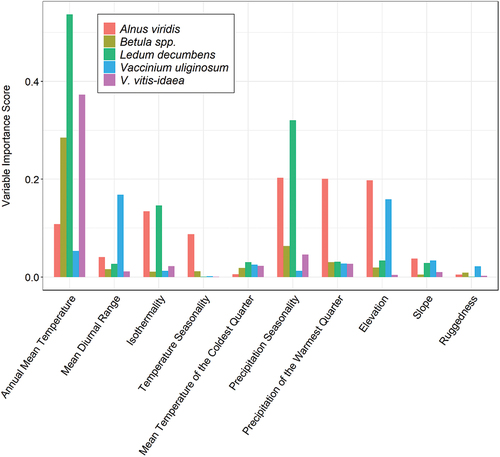
Figure 7. Importance scores for the predictor variables used in true absence ensemble SDM for each species.