Figures & data
Table 1. Summary of elevational position of treeline along the eastern face of the Mount of the Holy Cross, Colorado, as revealed by detailed inspection of four photographs: from William Henry Jackson (photograph taken 1873), Second View (Klett Citation1984), Third Views (Klett and Bajakian Citation2004), and a 2021 photograph taken by Kevin Berthiaume.
Figure 1. Four images of the east face of the Mount of the Holy Cross in Colorado. The red arrow in the 1978 image indicates the area of treeline advance that is the focus of the analyses presented in the text. The 1873 image was taken by William Henry Jackson; the 1978 and 2000 images were from repeat photography efforts, the Second View and Third Views (Klett Citation1984; Klett and Bajakian Citation2004), respectively. The 2021 view was taken by Kevin Berthiaume. Note the area of active forest expansion in the lower right portion of the view.
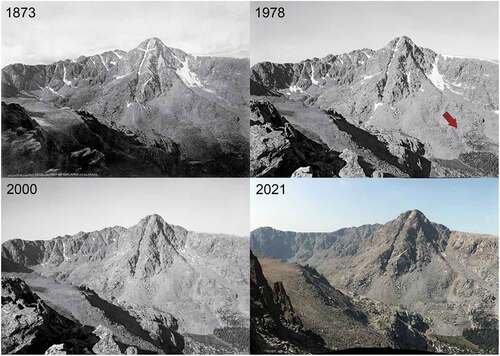
Figure 2. The 1873 William Henry Jackson photo of the east face of Mount of the Holy Cross (lightly cropped), with the hexagonal fishnet superimposed on the lower slopes. The 1873 extent of erect forest is shown in dark green, nonforest vegetation is shown in light green, and areas not covered by erect forest in 1873 but covered in erect forest by 2021 are illuminated in yellow.
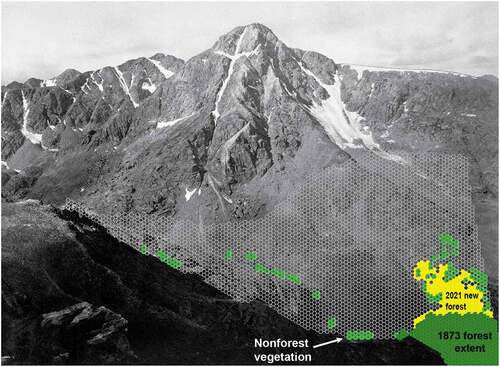
Figure 3. Summary of vegetation mass change, as reflected in NDVI images calculated from Landsat images for 1986, 2000, 2009, and 2020. The top four panels show NDVI values in the valley separating the vantage point (top right of each panel) from the peak of the Mount of the Holy Cross (bottom left of each panel). The bottom panel shows the difference between the 2020 and 1986 images, with higher values shown as darker shades of purple; the latter is overlaid with partial transparency on the digital elevation model, which is shown as a gradient from gray to red.
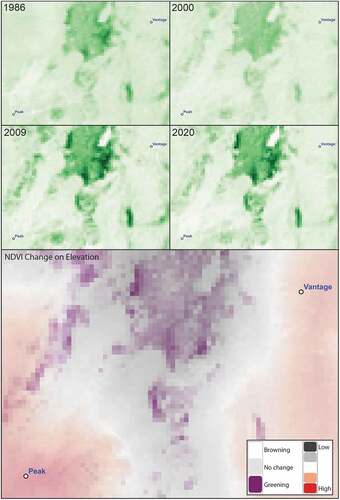
Figure 4. Summary of relationships between NDVI values and elevation (3,475–3,800 m) in the region shown in the panels of for four Landsat images. The 1986 relationship is shown as a green line and diamonds, 2000 is black dots and a line, 2009 is blue triangles and a broken line, and 2020 is red circles and a line.
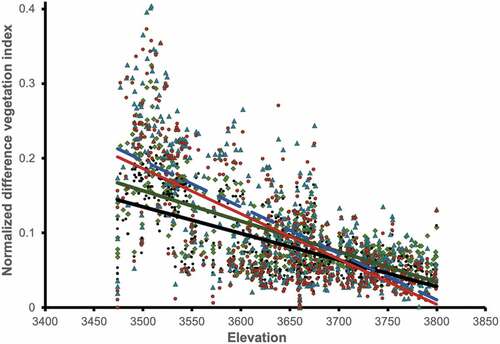
Table 2. Summary of relationships between NDVI values in four different images over the period 1986–2020.
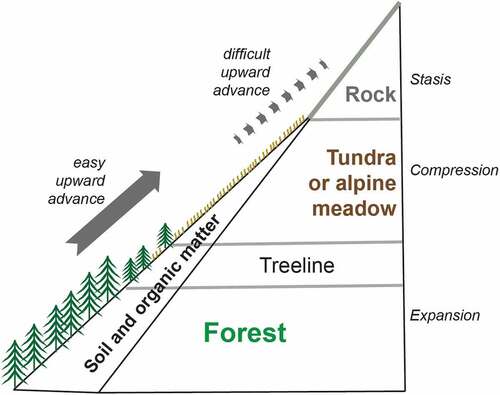
Figure 5. Diagram of treeline environments showing forest, tundra, or alpine meadows and bare rock at highest elevations. Note that soils become increasingly shallow and sterile at higher elevations, often ending in bare rock or talus slopes. For this reason, although forest is able to invade upward into tundra or meadows, the tundra/meadow habitat is unlikely to be able to invade upward, for lack of organic soils.