Figures & data
Figure 1. Map of burn history and sampled areas in the Yukon-Kuskokwim Delta (YKD) of Alaska. The bottom panel includes photos of plots sampled in reference, recent burn, and historic burn areas. Map created by Carl Churchill.
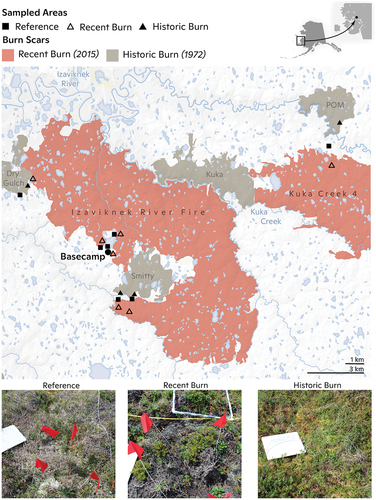
Table 1. Location and treatments for plots sampled for this study.
Table 2. Community level, functional type level, and key shrub species mean ± SE for biomass and C and N.
Figure 2. (a) Absolute and (b) mean relative within-treatment C stocks (or biomass) for each functional type and (c) absolute and (d) mean relative within-treatment N stocks. Points overlaid on box plots in (a) and (c) indicate the total C or N stock for a functional type in a single replicate plot. Box plot boundaries denote quartiles and medians, and whiskers denote 1.5 * interquartile range. The corresponding significance of differences between burn treatments can be found in .
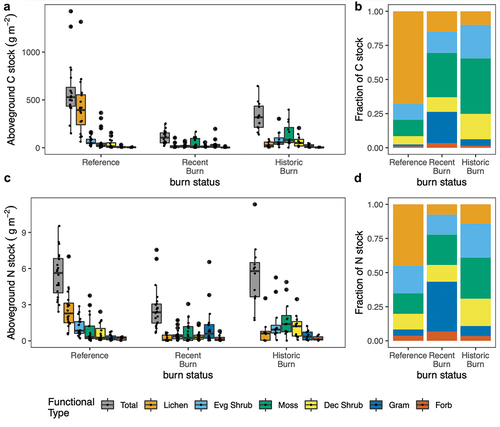
Figure 3. Carbon and N stocks and C:N of leaves (circle), stems (triangle), and whole plants (square) for four shrubs. Each row corresponds to the species denoted in the N stock column. Arithmetic mean and standard error are reported for C and N stocks, and geometric mean and standard deviation are reported for C:N.